

325
Production requirements:
s S
s bt
H x
s
M t T
∑
≤
∈
M t
(6)
s S
s bt
H x
s
m t T
∑
≥
∈
m t
(7)
s S
s bt
Q x
s
N t T
∑
≤
∈
N t
(8)
Extract once:
t T
st
x
s
st
S
∑ ≤ ∀ ∈
(9)
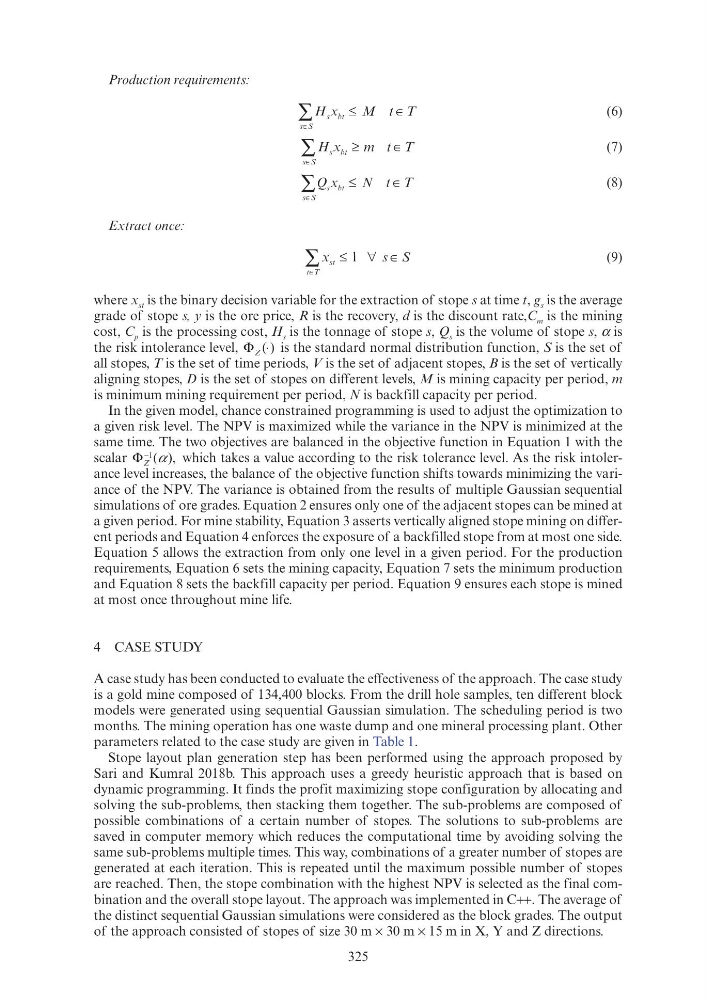
where x st is the binary decision variable for the extraction of stope s at time t, g s is the average
grade of stope s, y is the ore price, R is the recovery, d is the discount rate,C m is the mining
cost, C p is the processing cost, H s is the tonnage of stope s, Q s is the volume of stope s, α is
the risk intolerance level, Φ Z ( ) is the standard normal distribution function, S is the set of
all stopes, T is the set of time periods, V is the set of adjacent stopes, B is the set of vertically
aligning stopes, D is the set of stopes on different levels, M is mining capacity per period, m
is minimum mining requirement per period, N is backfill capacity per period.
In the given model, chance constrained programming is used to adjust the optimization to
a given risk level. The NPV is maximized while the variance in the NPV is minimized at the
same time. The two objectives are balanced in the objective function in Equation 1 with the
scalar Φ Z
−1 ( ),
) ) which takes a value according to the risk tolerance level. As the risk intolerance level increases, the balance of the objective function shifts towards minimizing the variance of the NPV. The variance is obtained from the results of multiple Gaussian sequential
simulations of ore grades. Equation 2 ensures only one of the adjacent stopes can be mined at
a given period. For mine stability, Equation 3 asserts vertically aligned stope mining on different periods and Equation 4 enforces the exposure of a backfilled stope from at most one side.
Equation 5 allows the extraction from only one level in a given period. For the production
requirements, Equation 6 sets the mining capacity, Equation 7 sets the minimum production
and Equation 8 sets the backfill capacity per period. Equation 9 ensures each stope is mined
at most once throughout mine life.
4 CASE STUDY
A case study has been conducted to evaluate the effectiveness of the approach. The case study
is a gold mine composed of 134,400 blocks. From the drill hole samples, ten different block
models were generated using sequential Gaussian simulation. The scheduling period is two
months. The mining operation has one waste dump and one mineral processing plant. Other
parameters related to the case study are given in Table 1.
Stope layout plan generation step has been performed using the approach proposed by
Sari and Kumral 2018b. This approach uses a greedy heuristic approach that is based on
dynamic programming. It finds the profit maximizing stope configuration by allocating and
solving the sub-problems, then stacking them together. The sub-problems are composed of
possible combinations of a certain number of stopes. The solutions to sub-problems are
saved in computer memory which reduces the computational time by avoiding solving the
same sub-problems multiple times. This way, combinations of a greater number of stopes are
generated at each iteration. This is repeated until the maximum possible number of stopes
are reached. Then, the stope combination with the highest NPV is selected as the final combination and the overall stope layout. The approach was implemented in C++. The average of
the distinct sequential Gaussian simulations were considered as the block grades. The output
of the approach consisted of stopes of size 30 m × 30 m × 15 m in X, Y and Z directions.
Production requirements:
s S
s bt
H x
s
M t T
∑
≤
∈
M t
(6)
s S
s bt
H x
s
m t T
∑
≥
∈
m t
(7)
s S
s bt
Q x
s
N t T
∑
≤
∈
N t
(8)
Extract once:
t T
st
x
s
st
S
∑ ≤ ∀ ∈
(9)
where x st is the binary decision variable for the extraction of stope s at time t, g s is the average
grade of stope s, y is the ore price, R is the recovery, d is the discount rate,C m is the mining
cost, C p is the processing cost, H s is the tonnage of stope s, Q s is the volume of stope s, α is
the risk intolerance level, Φ Z ( ) is the standard normal distribution function, S is the set of
all stopes, T is the set of time periods, V is the set of adjacent stopes, B is the set of vertically
aligning stopes, D is the set of stopes on different levels, M is mining capacity per period, m
is minimum mining requirement per period, N is backfill capacity per period.
In the given model, chance constrained programming is used to adjust the optimization to
a given risk level. The NPV is maximized while the variance in the NPV is minimized at the
same time. The two objectives are balanced in the objective function in Equation 1 with the
scalar Φ Z
−1 ( ),
) ) which takes a value according to the risk tolerance level. As the risk intolerance level increases, the balance of the objective function shifts towards minimizing the variance of the NPV. The variance is obtained from the results of multiple Gaussian sequential
simulations of ore grades. Equation 2 ensures only one of the adjacent stopes can be mined at
a given period. For mine stability, Equation 3 asserts vertically aligned stope mining on different periods and Equation 4 enforces the exposure of a backfilled stope from at most one side.
Equation 5 allows the extraction from only one level in a given period. For the production
requirements, Equation 6 sets the mining capacity, Equation 7 sets the minimum production
and Equation 8 sets the backfill capacity per period. Equation 9 ensures each stope is mined
at most once throughout mine life.
4 CASE STUDY
A case study has been conducted to evaluate the effectiveness of the approach. The case study
is a gold mine composed of 134,400 blocks. From the drill hole samples, ten different block
models were generated using sequential Gaussian simulation. The scheduling period is two
months. The mining operation has one waste dump and one mineral processing plant. Other
parameters related to the case study are given in Table 1.
Stope layout plan generation step has been performed using the approach proposed by
Sari and Kumral 2018b. This approach uses a greedy heuristic approach that is based on
dynamic programming. It finds the profit maximizing stope configuration by allocating and
solving the sub-problems, then stacking them together. The sub-problems are composed of
possible combinations of a certain number of stopes. The solutions to sub-problems are
saved in computer memory which reduces the computational time by avoiding solving the
same sub-problems multiple times. This way, combinations of a greater number of stopes are
generated at each iteration. This is repeated until the maximum possible number of stopes
are reached. Then, the stope combination with the highest NPV is selected as the final combination and the overall stope layout. The approach was implemented in C++. The average of
the distinct sequential Gaussian simulations were considered as the block grades. The output
of the approach consisted of stopes of size 30 m × 30 m × 15 m in X, Y and Z directions.