

326
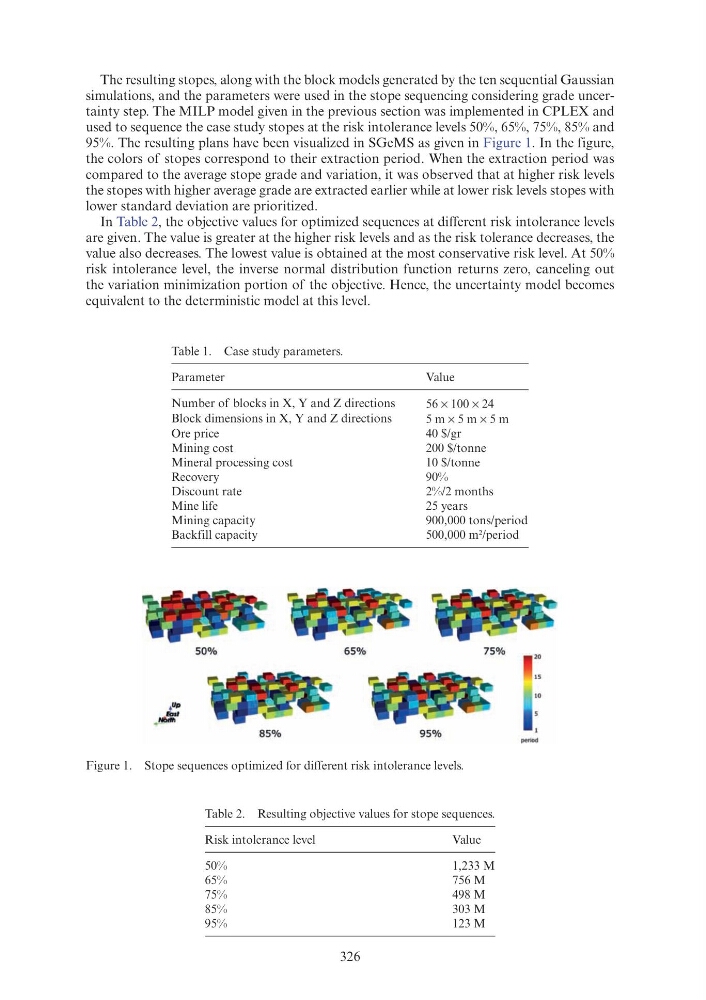
The resulting stopes, along with the block models generated by the ten sequential Gaussian
simulations, and the parameters were used in the stope sequencing considering grade uncertainty step. The MILP model given in the previous section was implemented in CPLEX and
used to sequence the case study stopes at the risk intolerance levels 50%, 65%, 75%, 85% and
95%. The resulting plans have been visualized in SGeMS as given in Figure 1. In the figure,
the colors of stopes correspond to their extraction period. When the extraction period was
compared to the average stope grade and variation, it was observed that at higher risk levels
the stopes with higher average grade are extracted earlier while at lower risk levels stopes with
lower standard deviation are prioritized.
In Table 2, the objective values for optimized sequences at different risk intolerance levels
are given. The value is greater at the higher risk levels and as the risk tolerance decreases, the
value also decreases. The lowest value is obtained at the most conservative risk level. At 50%
risk intolerance level, the inverse normal distribution function returns zero, canceling out
the variation minimization portion of the objective. Hence, the uncertainty model becomes
equivalent to the deterministic model at this level.
Table 1. Case study parameters.
Parameter
Value
Number of blocks in X, Y and Z directions
56 × 100 × 24
Block dimensions in X, Y and Z directions
5 m × 5 m × 5 m
Ore price
40 $/gr
Mining cost
200 $/tonne
Mineral processing cost
10 $/tonne
Recovery
90%
Discount rate
2%/2 months
Mine life
25 years
Mining capacity
900,000 tons/period
Backfill capacity
500,000 m2/period
Figure 1. Stope sequences optimized for different risk intolerance levels.
Table 2. Resulting objective values for stope sequences.
Risk intolerance level
Value
50%
1,233 M
65%
756 M
75%
498 M
85%
303 M
95%
123 M
50%
65%
75%
20
15
10
85%
95%
period
The resulting stopes, along with the block models generated by the ten sequential Gaussian
simulations, and the parameters were used in the stope sequencing considering grade uncertainty step. The MILP model given in the previous section was implemented in CPLEX and
used to sequence the case study stopes at the risk intolerance levels 50%, 65%, 75%, 85% and
95%. The resulting plans have been visualized in SGeMS as given in Figure 1. In the figure,
the colors of stopes correspond to their extraction period. When the extraction period was
compared to the average stope grade and variation, it was observed that at higher risk levels
the stopes with higher average grade are extracted earlier while at lower risk levels stopes with
lower standard deviation are prioritized.
In Table 2, the objective values for optimized sequences at different risk intolerance levels
are given. The value is greater at the higher risk levels and as the risk tolerance decreases, the
value also decreases. The lowest value is obtained at the most conservative risk level. At 50%
risk intolerance level, the inverse normal distribution function returns zero, canceling out
the variation minimization portion of the objective. Hence, the uncertainty model becomes
equivalent to the deterministic model at this level.
Table 1. Case study parameters.
Parameter
Value
Number of blocks in X, Y and Z directions
56 × 100 × 24
Block dimensions in X, Y and Z directions
5 m × 5 m × 5 m
Ore price
40 $/gr
Mining cost
200 $/tonne
Mineral processing cost
10 $/tonne
Recovery
90%
Discount rate
2%/2 months
Mine life
25 years
Mining capacity
900,000 tons/period
Backfill capacity
500,000 m2/period
Figure 1. Stope sequences optimized for different risk intolerance levels.
Table 2. Resulting objective values for stope sequences.
Risk intolerance level
Value
50%
1,233 M
65%
756 M
75%
498 M
85%
303 M
95%
123 M
50%
65%
75%
20
15
10
85%
95%
period