

297
All analysis were done for complete sublevel areas or continuous smaller areas where waste
zones were present.
3.1.2 Value optimization
Instead of gold content, in this second analysis, a profit value was calculated for each
slice. This value is a cash flow of the marginal costs of each slice according to unit costs
below:
• Gold price: US$ 1,200/oz
• Taxes: US$ 21.60/oz
• Mine and plant costs: US$ 59.60/t
The algorithm approach is the same: minimize the profit left as pillar. Thus, the same software can be used for such analysis.
4 RESULTS AND DISCUSSIONS
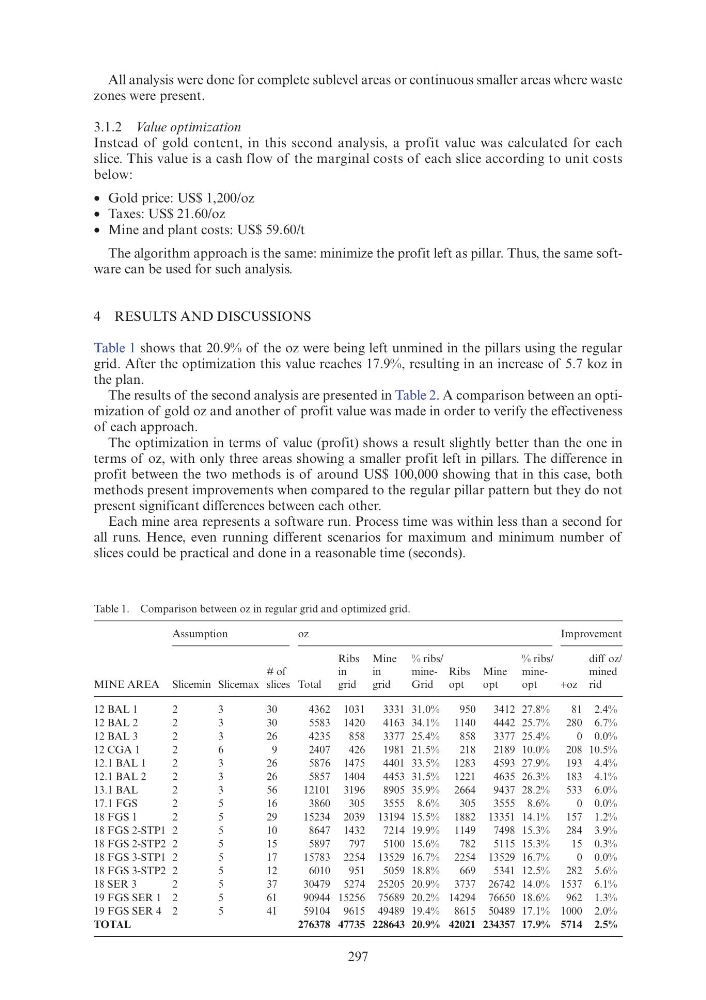
Table 1 shows that 20.9% of the oz were being left unmined in the pillars using the regular
grid. After the optimization this value reaches 17.9%, resulting in an increase of 5.7 koz in
the plan.
The results of the second analysis are presented in Table 2. A comparison between an optimization of gold oz and another of profit value was made in order to verify the effectiveness
of each approach.
The optimization in terms of value (profit) shows a result slightly better than the one in
terms of oz, with only three areas showing a smaller profit left in pillars. The difference in
profit between the two methods is of around US$ 100,000 showing that in this case, both
methods present improvements when compared to the regular pillar pattern but they do not
present significant differences between each other.
Each mine area represents a software run. Process time was within less than a second for
all runs. Hence, even running different scenarios for maximum and minimum number of
slices could be practical and done in a reasonable time (seconds).
Table 1. Comparison between oz in regular grid and optimized grid.
MINE AREA
Assumption
oz
Improvement
Slicemin Slicemax
# of
slices Total
Ribs
in
grid
Mine
in
grid
% ribs/
mineGrid
Ribs
opt
Mine
opt
% ribs/
mineopt
+oz
diff oz/
mined
rid
12 BAL 1
2
3
30
4362 1031
3331 31.0%
950
3412 27.8%
81 2.4%
12 BAL 2
2
3
30
5583 1420
4163 34.1% 1140
4442 25.7%
280 6.7%
12 BAL 3
2
3
26
4235
858
3377 25.4%
858
3377 25.4%
0 0.0%
12 CGA 1
2
6
9
2407
426
1981 21.5%
218
2189 10.0%
208 10.5%
12.1 BAL 1
2
3
26
5876 1475
4401 33.5% 1283
4593 27.9%
193 4.4%
12.1 BAL 2
2
3
26
5857 1404
4453 31.5% 1221
4635 26.3%
183 4.1%
13.1 BAL
2
3
56
12101 3196
8905 35.9% 2664
9437 28.2%
533 6.0%
17.1 FGS
2
5
16
3860
305
3555 8.6%
305
3555 8.6%
0 0.0%
18 FGS 1
2
5
29
15234 2039 13194 15.5% 1882 13351 14.1%
157 1.2%
18 FGS 2-STP1 2
5
10
8647 1432
7214 19.9% 1149
7498 15.3%
284 3.9%
18 FGS 2-STP2 2
5
15
5897
797
5100 15.6%
782
5115 15.3%
15 0.3%
18 FGS 3-STP1 2
5
17
15783 2254 13529 16.7% 2254 13529 16.7%
0 0.0%
18 FGS 3-STP2 2
5
12
6010
951
5059 18.8%
669
5341 12.5%
282 5.6%
18 SER 3
2
5
37
30479 5274 25205 20.9% 3737 26742 14.0% 1537 6.1%
19 FGS SER 1 2
5
61
90944 15256 75689 20.2% 14294 76650 18.6%
962 1.3%
19 FGS SER 4 2
5
41
59104 9615 49489 19.4% 8615 50489 17.1% 1000 2.0%
TOTAL
276378 47735 228643 20.9% 42021 234357 17.9% 5714 2.5%
All analysis were done for complete sublevel areas or continuous smaller areas where waste
zones were present.
3.1.2 Value optimization
Instead of gold content, in this second analysis, a profit value was calculated for each
slice. This value is a cash flow of the marginal costs of each slice according to unit costs
below:
• Gold price: US$ 1,200/oz
• Taxes: US$ 21.60/oz
• Mine and plant costs: US$ 59.60/t
The algorithm approach is the same: minimize the profit left as pillar. Thus, the same software can be used for such analysis.
4 RESULTS AND DISCUSSIONS
Table 1 shows that 20.9% of the oz were being left unmined in the pillars using the regular
grid. After the optimization this value reaches 17.9%, resulting in an increase of 5.7 koz in
the plan.
The results of the second analysis are presented in Table 2. A comparison between an optimization of gold oz and another of profit value was made in order to verify the effectiveness
of each approach.
The optimization in terms of value (profit) shows a result slightly better than the one in
terms of oz, with only three areas showing a smaller profit left in pillars. The difference in
profit between the two methods is of around US$ 100,000 showing that in this case, both
methods present improvements when compared to the regular pillar pattern but they do not
present significant differences between each other.
Each mine area represents a software run. Process time was within less than a second for
all runs. Hence, even running different scenarios for maximum and minimum number of
slices could be practical and done in a reasonable time (seconds).
Table 1. Comparison between oz in regular grid and optimized grid.
MINE AREA
Assumption
oz
Improvement
Slicemin Slicemax
# of
slices Total
Ribs
in
grid
Mine
in
grid
% ribs/
mineGrid
Ribs
opt
Mine
opt
% ribs/
mineopt
+oz
diff oz/
mined
rid
12 BAL 1
2
3
30
4362 1031
3331 31.0%
950
3412 27.8%
81 2.4%
12 BAL 2
2
3
30
5583 1420
4163 34.1% 1140
4442 25.7%
280 6.7%
12 BAL 3
2
3
26
4235
858
3377 25.4%
858
3377 25.4%
0 0.0%
12 CGA 1
2
6
9
2407
426
1981 21.5%
218
2189 10.0%
208 10.5%
12.1 BAL 1
2
3
26
5876 1475
4401 33.5% 1283
4593 27.9%
193 4.4%
12.1 BAL 2
2
3
26
5857 1404
4453 31.5% 1221
4635 26.3%
183 4.1%
13.1 BAL
2
3
56
12101 3196
8905 35.9% 2664
9437 28.2%
533 6.0%
17.1 FGS
2
5
16
3860
305
3555 8.6%
305
3555 8.6%
0 0.0%
18 FGS 1
2
5
29
15234 2039 13194 15.5% 1882 13351 14.1%
157 1.2%
18 FGS 2-STP1 2
5
10
8647 1432
7214 19.9% 1149
7498 15.3%
284 3.9%
18 FGS 2-STP2 2
5
15
5897
797
5100 15.6%
782
5115 15.3%
15 0.3%
18 FGS 3-STP1 2
5
17
15783 2254 13529 16.7% 2254 13529 16.7%
0 0.0%
18 FGS 3-STP2 2
5
12
6010
951
5059 18.8%
669
5341 12.5%
282 5.6%
18 SER 3
2
5
37
30479 5274 25205 20.9% 3737 26742 14.0% 1537 6.1%
19 FGS SER 1 2
5
61
90944 15256 75689 20.2% 14294 76650 18.6%
962 1.3%
19 FGS SER 4 2
5
41
59104 9615 49489 19.4% 8615 50489 17.1% 1000 2.0%
TOTAL
276378 47735 228643 20.9% 42021 234357 17.9% 5714 2.5%