

298
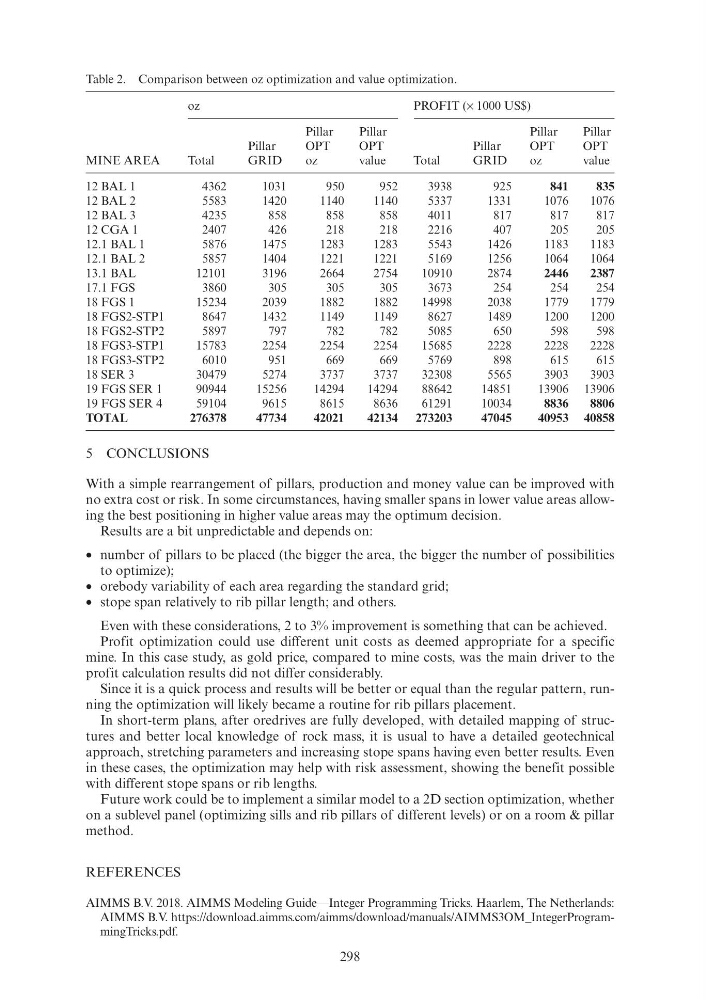
Table 2. Comparison between oz optimization and value optimization.
MINE AREA
oz
PROFIT (× 1000 US$)
Total
Pillar
GRID
Pillar
OPT
oz
Pillar
OPT
value
Total
Pillar
GRID
Pillar
OPT
oz
Pillar
OPT
value
12 BAL 1
4362
1031
950
952
3938
925
841
835
12 BAL 2
5583
1420
1140
1140
5337
1331
1076
1076
12 BAL 3
4235
858
858
858
4011
817
817
817
12 CGA 1
2407
426
218
218
2216
407
205
205
12.1 BAL 1
5876
1475
1283
1283
5543
1426
1183
1183
12.1 BAL 2
5857
1404
1221
1221
5169
1256
1064
1064
13.1 BAL
12101
3196
2664
2754
10910
2874
2446
2387
17.1 FGS
3860
305
305
305
3673
254
254
254
18 FGS 1
15234
2039
1882
1882
14998
2038
1779
1779
18 FGS2-STP1
8647
1432
1149
1149
8627
1489
1200
1200
18 FGS2-STP2
5897
797
782
782
5085
650
598
598
18 FGS3-STP1
15783
2254
2254
2254
15685
2228
2228
2228
18 FGS3-STP2
6010
951
669
669
5769
898
615
615
18 SER 3
30479
5274
3737
3737
32308
5565
3903
3903
19 FGS SER 1
90944
15256
14294
14294
88642
14851
13906 13906
19 FGS SER 4
59104
9615
8615
8636
61291
10034
8836
8806
TOTAL
276378
47734
42021
42134 273203
47045
40953 40858
5 CONCLUSIONS
With a simple rearrangement of pillars, production and money value can be improved with
no extra cost or risk. In some circumstances, having smaller spans in lower value areas allowing the best positioning in higher value areas may the optimum decision.
Results are a bit unpredictable and depends on:
• number of pillars to be placed (the bigger the area, the bigger the number of possibilities
to optimize);
• orebody variability of each area regarding the standard grid;
• stope span relatively to rib pillar length; and others.
Even with these considerations, 2 to 3% improvement is something that can be achieved.
Profit optimization could use different unit costs as deemed appropriate for a specific
mine. In this case study, as gold price, compared to mine costs, was the main driver to the
profit calculation results did not differ considerably.
Since it is a quick process and results will be better or equal than the regular pattern, running the optimization will likely became a routine for rib pillars placement.
In short-term plans, after oredrives are fully developed, with detailed mapping of structures and better local knowledge of rock mass, it is usual to have a detailed geotechnical
approach, stretching parameters and increasing stope spans having even better results. Even
in these cases, the optimization may help with risk assessment, showing the benefit possible
with different stope spans or rib lengths.
Future work could be to implement a similar model to a 2D section optimization, whether
on a sublevel panel (optimizing sills and rib pillars of different levels) or on a room & pillar
method.
REFERENCES
AIMMS B.V. 2018. AIMMS Modeling Guide—Integer Programming Tricks. Haarlem, The Netherlands:
AIMMS B.V. https://download.aimms.com/aimms/download/manuals/AIMMS3OM_IntegerProgrammingTricks.pdf.
Table 2. Comparison between oz optimization and value optimization.
MINE AREA
oz
PROFIT (× 1000 US$)
Total
Pillar
GRID
Pillar
OPT
oz
Pillar
OPT
value
Total
Pillar
GRID
Pillar
OPT
oz
Pillar
OPT
value
12 BAL 1
4362
1031
950
952
3938
925
841
835
12 BAL 2
5583
1420
1140
1140
5337
1331
1076
1076
12 BAL 3
4235
858
858
858
4011
817
817
817
12 CGA 1
2407
426
218
218
2216
407
205
205
12.1 BAL 1
5876
1475
1283
1283
5543
1426
1183
1183
12.1 BAL 2
5857
1404
1221
1221
5169
1256
1064
1064
13.1 BAL
12101
3196
2664
2754
10910
2874
2446
2387
17.1 FGS
3860
305
305
305
3673
254
254
254
18 FGS 1
15234
2039
1882
1882
14998
2038
1779
1779
18 FGS2-STP1
8647
1432
1149
1149
8627
1489
1200
1200
18 FGS2-STP2
5897
797
782
782
5085
650
598
598
18 FGS3-STP1
15783
2254
2254
2254
15685
2228
2228
2228
18 FGS3-STP2
6010
951
669
669
5769
898
615
615
18 SER 3
30479
5274
3737
3737
32308
5565
3903
3903
19 FGS SER 1
90944
15256
14294
14294
88642
14851
13906 13906
19 FGS SER 4
59104
9615
8615
8636
61291
10034
8836
8806
TOTAL
276378
47734
42021
42134 273203
47045
40953 40858
5 CONCLUSIONS
With a simple rearrangement of pillars, production and money value can be improved with
no extra cost or risk. In some circumstances, having smaller spans in lower value areas allowing the best positioning in higher value areas may the optimum decision.
Results are a bit unpredictable and depends on:
• number of pillars to be placed (the bigger the area, the bigger the number of possibilities
to optimize);
• orebody variability of each area regarding the standard grid;
• stope span relatively to rib pillar length; and others.
Even with these considerations, 2 to 3% improvement is something that can be achieved.
Profit optimization could use different unit costs as deemed appropriate for a specific
mine. In this case study, as gold price, compared to mine costs, was the main driver to the
profit calculation results did not differ considerably.
Since it is a quick process and results will be better or equal than the regular pattern, running the optimization will likely became a routine for rib pillars placement.
In short-term plans, after oredrives are fully developed, with detailed mapping of structures and better local knowledge of rock mass, it is usual to have a detailed geotechnical
approach, stretching parameters and increasing stope spans having even better results. Even
in these cases, the optimization may help with risk assessment, showing the benefit possible
with different stope spans or rib lengths.
Future work could be to implement a similar model to a 2D section optimization, whether
on a sublevel panel (optimizing sills and rib pillars of different levels) or on a room & pillar
method.
REFERENCES
AIMMS B.V. 2018. AIMMS Modeling Guide—Integer Programming Tricks. Haarlem, The Netherlands:
AIMMS B.V. https://download.aimms.com/aimms/download/manuals/AIMMS3OM_IntegerProgrammingTricks.pdf.