

276
Table 2. Performance of the mathematical model and algorithm in terms of tonnage and value
differences.
Instance
Global
slope
angle
Interramp
angle
range
# Benches
to measure
global angle
Max pit
tonnage
difference
math model
(%)
Max pit
value
difference
math model
(%)
Max pit
tonnage
difference
algorithm
(%)
Max pit
value
difference
algorithm
(%)
Marvin
45.6
50–55
15–20
3%
1%
1%
1%
Marvin2
47.4
50–55
15–20
3%
1%
3%
2%
KD
45
50–55
5–15
14%
10%
15%
14%
ZMedium 45
50–55
10–20
20%
6%
20%
7%
ZSmall
45
50–55
10–15
12%
6%
15%
11%
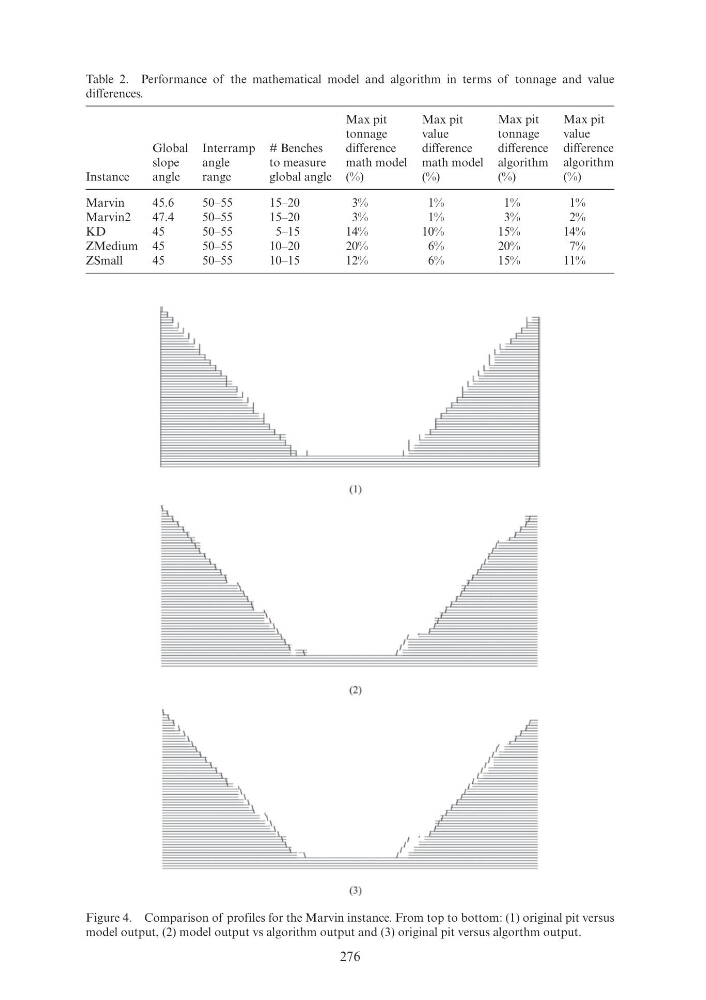
Figure 4. Comparison of profiles for the Marvin instance. From top to bottom: (1) original pit versus
model output, (2) model output vs algorithm output and (3) original pit versus algorthm output.
( I )
(2)
(3)
Table 2. Performance of the mathematical model and algorithm in terms of tonnage and value
differences.
Instance
Global
slope
angle
Interramp
angle
range
# Benches
to measure
global angle
Max pit
tonnage
difference
math model
(%)
Max pit
value
difference
math model
(%)
Max pit
tonnage
difference
algorithm
(%)
Max pit
value
difference
algorithm
(%)
Marvin
45.6
50–55
15–20
3%
1%
1%
1%
Marvin2
47.4
50–55
15–20
3%
1%
3%
2%
KD
45
50–55
5–15
14%
10%
15%
14%
ZMedium 45
50–55
10–20
20%
6%
20%
7%
ZSmall
45
50–55
10–15
12%
6%
15%
11%
Figure 4. Comparison of profiles for the Marvin instance. From top to bottom: (1) original pit versus
model output, (2) model output vs algorithm output and (3) original pit versus algorthm output.
( I )
(2)
(3)