

277
respect to the values in Table 1, however it is worth noting that most of the differences are due
to the gap between the original pushback and the result from mathematical model, with the
gap for the algorithm being always less than 2% with regards to the model’s result.
As it can be seen from the results, the performance of the total variation in terms of
value and tonnage can vary significantly from case to case, however the highest difference
is introduced by the mathematical model rather than the postprocessing algorithm, which
is even capable to reduce the gap sometimes. This is encouraging, because indeed the large
differences are mostly due to the several approximations that the mathematical model must
perform in terms to describe a ramp in terms of blocks, which do not always fit the bench
heigh or ramp width.
Figure 4 depicts the profiles obtained for the Marvin instance which can be considered as
the best case. The figure shows the comparison of profiles between the original final pit and
the result of the optimization model, the comparison between the result of the optimization
model and the output of the postprocessing algorithm, and the comparison between the
original pit and the output of the postprocessing algorithm.
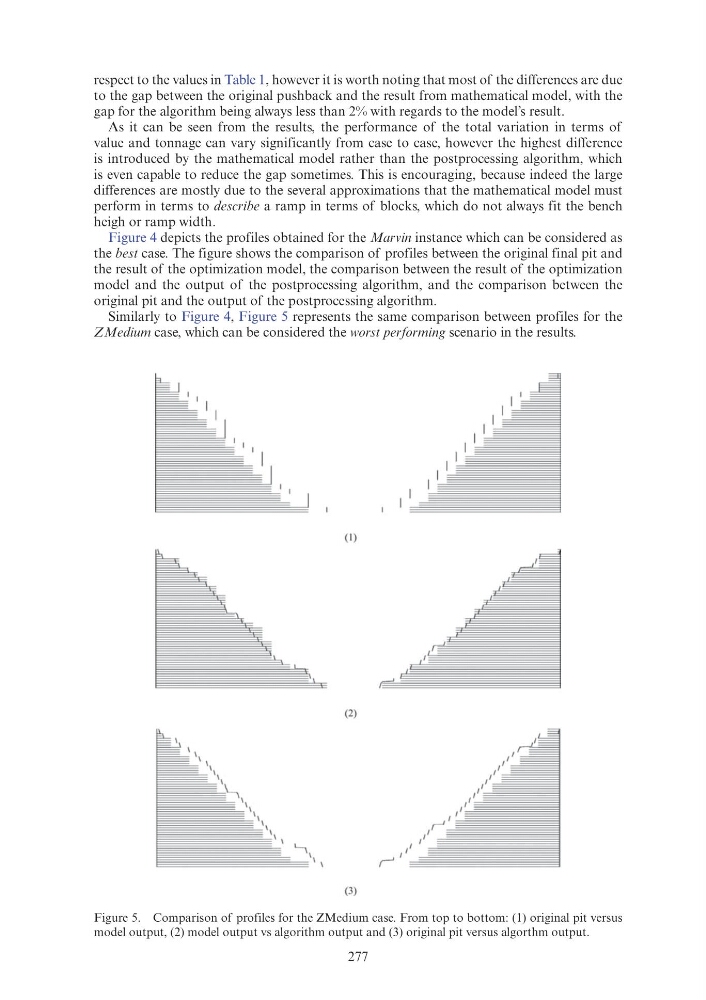
Similarly to Figure 4, Figure 5 represents the same comparison between profiles for the
ZMedium case, which can be considered the worst performing scenario in the results.
Figure 5. Comparison of profiles for the ZMedium case. From top to bottom: (1) original pit versus
model output, (2) model output vs algorithm output and (3) original pit versus algorthm output.
I I
( 1)
~
E;
E
I
-
(2)
f=l I
~ \1 \ \
'- , \ II 1\
:= II I 'I
-
\ I
(3)
respect to the values in Table 1, however it is worth noting that most of the differences are due
to the gap between the original pushback and the result from mathematical model, with the
gap for the algorithm being always less than 2% with regards to the model’s result.
As it can be seen from the results, the performance of the total variation in terms of
value and tonnage can vary significantly from case to case, however the highest difference
is introduced by the mathematical model rather than the postprocessing algorithm, which
is even capable to reduce the gap sometimes. This is encouraging, because indeed the large
differences are mostly due to the several approximations that the mathematical model must
perform in terms to describe a ramp in terms of blocks, which do not always fit the bench
heigh or ramp width.
Figure 4 depicts the profiles obtained for the Marvin instance which can be considered as
the best case. The figure shows the comparison of profiles between the original final pit and
the result of the optimization model, the comparison between the result of the optimization
model and the output of the postprocessing algorithm, and the comparison between the
original pit and the output of the postprocessing algorithm.
Similarly to Figure 4, Figure 5 represents the same comparison between profiles for the
ZMedium case, which can be considered the worst performing scenario in the results.
Figure 5. Comparison of profiles for the ZMedium case. From top to bottom: (1) original pit versus
model output, (2) model output vs algorithm output and (3) original pit versus algorthm output.
I I
( 1)
~
E;
E
I
-
(2)
f=l I
~ \1 \ \
'- , \ II 1\
:= II I 'I
-
\ I
(3)