

268
Adding to the formula is the incremental cost INC (Rendu, 2008), which represents the cost
difference between mining a block of ore and a block of waste (usually occurs by the variation of transport distance between the plant and the beneficiation or the waste stockpile).
MCOG
INC
R
=
+
(
)
V
C C
+
* ( PV −
P
G
C
+ &A
(9)
where: Inc = incremental transport cost
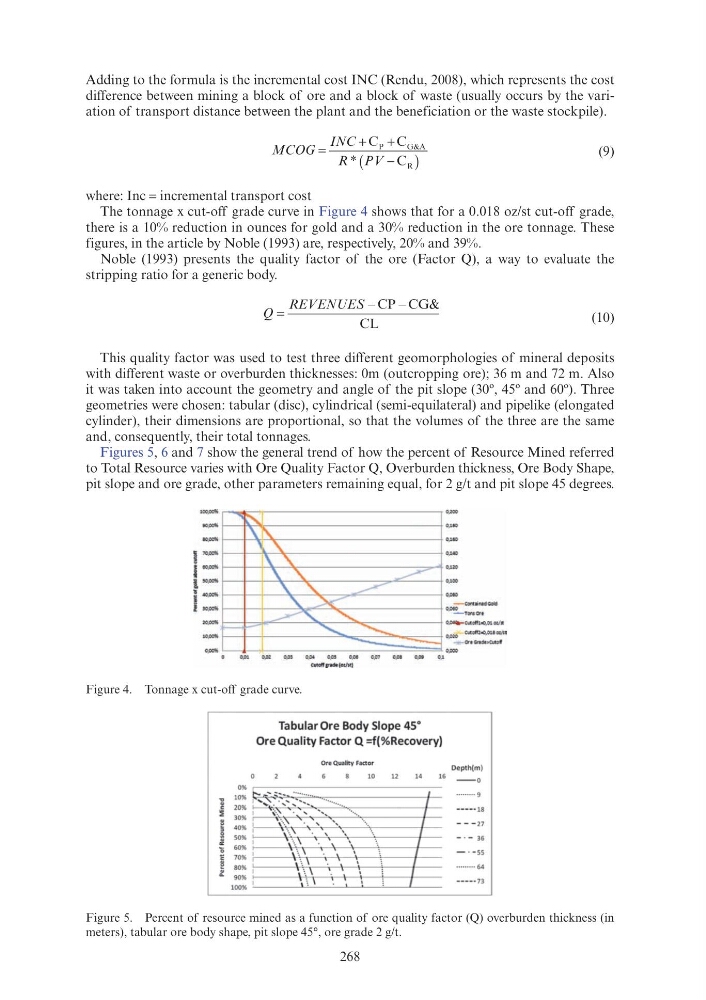
The tonnage x cut-off grade curve in Figure 4 shows that for a 0.018 oz/st cut-off grade,
there is a 10% reduction in ounces for gold and a 30% reduction in the ore tonnage. These
figures, in the article by Noble (1993) are, respectively, 20% and 39%.
Noble (1993) presents the quality factor of the ore (Factor Q), a way to evaluate the
stripping ratio for a generic body.
Q
REVENUES
=
−
−
CP CG&
CL
(10)
This quality factor was used to test three different geomorphologies of mineral deposits
with different waste or overburden thicknesses: 0m (outcropping ore); 36 m and 72 m. Also
it was taken into account the geometry and angle of the pit slope (30º, 45º and 60º). Three
geometries were chosen: tabular (disc), cylindrical (semi-equilateral) and pipelike (elongated
cylinder), their dimensions are proportional, so that the volumes of the three are the same
and, consequently, their total tonnages.
Figures 5, 6 and 7 show the general trend of how the percent of Resource Mined referred
to Total Resource varies with Ore Quality Factor Q, Overburden thickness, Ore Body Shape,
pit slope and ore grade, other parameters remaining equal, for 2 g/t and pit slope 45 degrees.
Figure 4. Tonnage x cut-off grade curve.
Figure 5. Percent of resource mined as a function of ore quality factor (Q) overburden thickness (in
meters), tabular ore body shape, pit slope 45°, ore grade 2 g/t.
,.,..,.
"'""' w ....
~ "' ""'
l
~
,...,.
! ......
~ "'""'
I "'""'
"""'
"""' .....
~
' ' "'
\ "'
\. '
~
"' ' --'\. .><-~
..........
'-..... ......._
-
-
-
-
-
-
-
-
-
u
CUtoff gD (ol/stl
Tabular Ore Body Slope 45•
Ore Quality Factor Q =f(%Recovery)
Ore Qualit y Facto r
,,.,
0,110
'·""
0,120
0,100
'""' - eontained Gold
0,0150 -
TOns 0rt
O~cutoffl.O,Ot ot/'11.
O,O~cutoff;t.O,OU otht
~Ort Gr~dvcutof
'""'
Dept h(m)
10
12
14
16
- -o
0%
10% I ...._:' .;:~: ... ~~:·:·~·· ..... .
:~: I ~. . . . ~-- '--' ,''-<:------''-o-------jl-r---.~ . ', ' ,
40%
SO%
60%
70%
80%
90%
100%
\
. ........ 9
----· 18
- - - 27
- . - 36
· - ss
......... 64
----· 73
Adding to the formula is the incremental cost INC (Rendu, 2008), which represents the cost
difference between mining a block of ore and a block of waste (usually occurs by the variation of transport distance between the plant and the beneficiation or the waste stockpile).
MCOG
INC
R
=
+
(
)
V
C C
+
* ( PV −
P
G
C
+ &A
(9)
where: Inc = incremental transport cost
The tonnage x cut-off grade curve in Figure 4 shows that for a 0.018 oz/st cut-off grade,
there is a 10% reduction in ounces for gold and a 30% reduction in the ore tonnage. These
figures, in the article by Noble (1993) are, respectively, 20% and 39%.
Noble (1993) presents the quality factor of the ore (Factor Q), a way to evaluate the
stripping ratio for a generic body.
Q
REVENUES
=
−
−
CP CG&
CL
(10)
This quality factor was used to test three different geomorphologies of mineral deposits
with different waste or overburden thicknesses: 0m (outcropping ore); 36 m and 72 m. Also
it was taken into account the geometry and angle of the pit slope (30º, 45º and 60º). Three
geometries were chosen: tabular (disc), cylindrical (semi-equilateral) and pipelike (elongated
cylinder), their dimensions are proportional, so that the volumes of the three are the same
and, consequently, their total tonnages.
Figures 5, 6 and 7 show the general trend of how the percent of Resource Mined referred
to Total Resource varies with Ore Quality Factor Q, Overburden thickness, Ore Body Shape,
pit slope and ore grade, other parameters remaining equal, for 2 g/t and pit slope 45 degrees.
Figure 4. Tonnage x cut-off grade curve.
Figure 5. Percent of resource mined as a function of ore quality factor (Q) overburden thickness (in
meters), tabular ore body shape, pit slope 45°, ore grade 2 g/t.
,.,..,.
"'""' w ....
~ "' ""'
l
~
,...,.
! ......
~ "'""'
I "'""'
"""'
"""' .....
~
' ' "'
\ "'
\. '
~
"' ' --'\. .><-~
..........
'-..... ......._
-
-
-
-
-
-
-
-
-
u
CUtoff gD (ol/stl
Tabular Ore Body Slope 45•
Ore Quality Factor Q =f(%Recovery)
Ore Qualit y Facto r
,,.,
0,110
'·""
0,120
0,100
'""' - eontained Gold
0,0150 -
TOns 0rt
O~cutoffl.O,Ot ot/'11.
O,O~cutoff;t.O,OU otht
~Ort Gr~dvcutof
'""'
Dept h(m)
10
12
14
16
- -o
0%
10% I ...._:' .;:~: ... ~~:·:·~·· ..... .
:~: I ~. . . . ~-- '--' ,''-<:------''-o-------jl-r---.~ . ', ' ,
40%
SO%
60%
70%
80%
90%
100%
\
. ........ 9
----· 18
- - - 27
- . - 36
· - ss
......... 64
----· 73