

265
In this paper a (hypothetical situation is presented where the above mentioned factors
are simplified following only the geological type and its theoretical critical pit slope and
considering the sound state of the rock. Hard and healthy rocks, such as granite, allow larger
angles (e.g. 60°), sandstones intermediate angles (45°) and soft rocks, such as phyllites and
schists, smaller angles (30°). The presence of fractures and weathering processes were not
taken into account.
According to Evans (1993) the morphology of the mineral deposits considered in this work
can be generally classified as discordant with regular contours and confined within a portion
of the host rock. As a result, most of these ore bodies are tabular or tubular shaped. Gold
bearing veins are generally contained in tabular (or lenticular) bodies that are structurally
controlled forming ore shoots. Diamond ores are characteristically hosted in tubular bodies
that are known as “pipes” if the pitch is sub-vertical, or pods which are generally referred to
for chromite ore seams.
2 BASIC CONCEPTS
Estimation of mineral resource is the first step in the evaluation of mineral deposits.
Resources may be subdivided into measured, indicated and inferred, according to the level of
confidence in the data acquisition and interpretation. Part of the resources are transformed
in reserves if economic viability is demonstrated. Reserves may be proved or probable and as
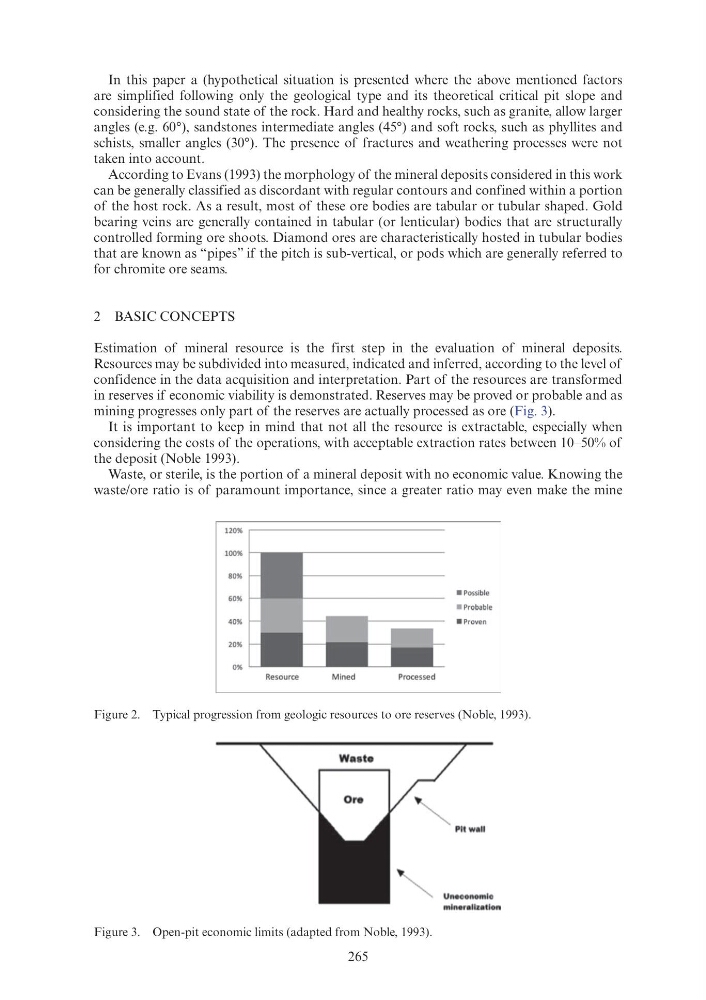
mining progresses only part of the reserves are actually processed as ore (Fig. 3).
It is important to keep in mind that not all the resource is extractable, especially when
considering the costs of the operations, with acceptable extraction rates between 10–50% of
the deposit (Noble 1993).
Waste, or sterile, is the portion of a mineral deposit with no economic value. Knowing the
waste/ore ratio is of paramount importance, since a greater ratio may even make the mine
Figure 2. Typical progression from geologic resources to ore reserves (Noble, 1993).
Figure 3. Open-pit economic limits (adapted from Noble, 1993).
120%
100%
80%
• Possible
60%
• Probable
40%
• Prove n
20%
0%
Resource
M ined
Processed
In this paper a (hypothetical situation is presented where the above mentioned factors
are simplified following only the geological type and its theoretical critical pit slope and
considering the sound state of the rock. Hard and healthy rocks, such as granite, allow larger
angles (e.g. 60°), sandstones intermediate angles (45°) and soft rocks, such as phyllites and
schists, smaller angles (30°). The presence of fractures and weathering processes were not
taken into account.
According to Evans (1993) the morphology of the mineral deposits considered in this work
can be generally classified as discordant with regular contours and confined within a portion
of the host rock. As a result, most of these ore bodies are tabular or tubular shaped. Gold
bearing veins are generally contained in tabular (or lenticular) bodies that are structurally
controlled forming ore shoots. Diamond ores are characteristically hosted in tubular bodies
that are known as “pipes” if the pitch is sub-vertical, or pods which are generally referred to
for chromite ore seams.
2 BASIC CONCEPTS
Estimation of mineral resource is the first step in the evaluation of mineral deposits.
Resources may be subdivided into measured, indicated and inferred, according to the level of
confidence in the data acquisition and interpretation. Part of the resources are transformed
in reserves if economic viability is demonstrated. Reserves may be proved or probable and as
mining progresses only part of the reserves are actually processed as ore (Fig. 3).
It is important to keep in mind that not all the resource is extractable, especially when
considering the costs of the operations, with acceptable extraction rates between 10–50% of
the deposit (Noble 1993).
Waste, or sterile, is the portion of a mineral deposit with no economic value. Knowing the
waste/ore ratio is of paramount importance, since a greater ratio may even make the mine
Figure 2. Typical progression from geologic resources to ore reserves (Noble, 1993).
Figure 3. Open-pit economic limits (adapted from Noble, 1993).
120%
100%
80%
• Possible
60%
• Probable
40%
• Prove n
20%
0%
Resource
M ined
Processed