

251
• Measured <0.5
• Indicated <1.0
• Inferred >1.0
This is visually appropriate and provides similar quantities to the multiple search method,
requiring two independent drill holes within 50%, 100%, and 150% of the variogram range
respectively.
6 CASE STUDY 2 – HILL TOP
The Hill Top Case Study analyzes a massive magnetite deposit in early stage exploration drilling. The deposit was discovered by aeromagnetic mapping. It is one of several hilltops in an
area containing elevated magnetic anomalies.
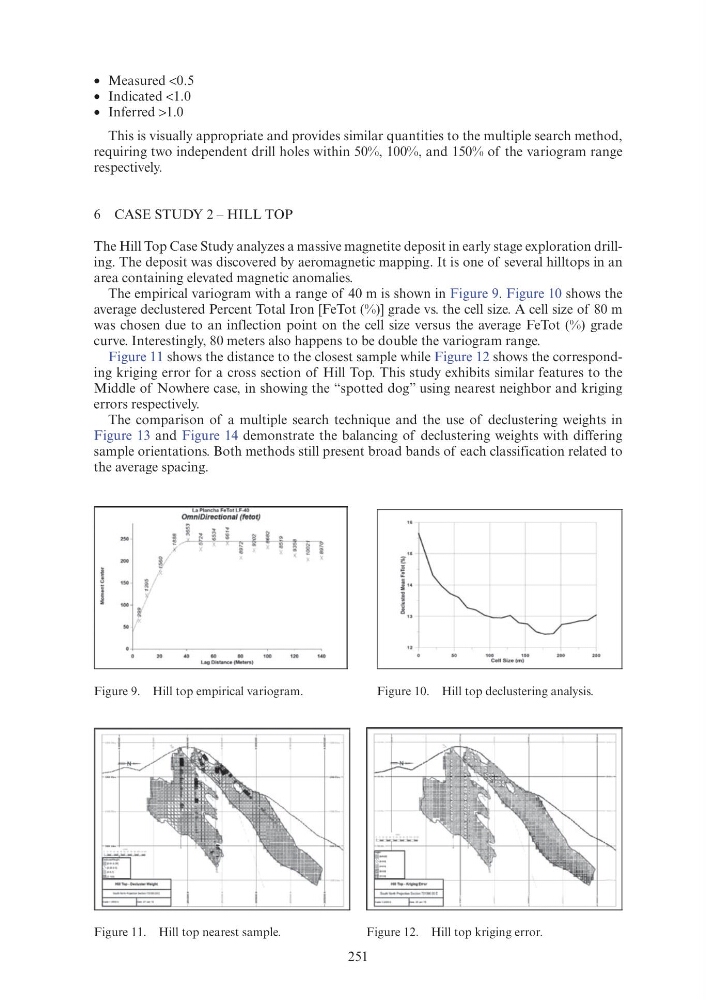
The empirical variogram with a range of 40 m is shown in Figure 9. Figure 10 shows the
average declustered Percent Total Iron [FeTot (%)] grade vs. the cell size. A cell size of 80 m
was chosen due to an inflection point on the cell size versus the average FeTot (%) grade
curve. Interestingly, 80 meters also happens to be double the variogram range.
Figure 11 shows the distance to the closest sample while Figure 12 shows the corresponding kriging error for a cross section of Hill Top. This study exhibits similar features to the
Middle of Nowhere case, in showing the “spotted dog” using nearest neighbor and kriging
errors respectively.
The comparison of a multiple search technique and the use of declustering weights in
Figure 13 and Figure 14 demonstrate the balancing of declustering weights with differing
sample orientations. Both methods still present broad bands of each classification related to
the average spacing.
Figure 9. Hill top empirical variogram.
Figure 10. Hill top declustering analysis.
Figure 11. Hill top nearest sample.
Figure 12. Hill top kriging error.
LaPianeha F"•TotLF-40
OmniDirectional (fetot)
"
LagDistanc•{M•IKS)
1 00
150
Call Siza (m)
• Measured <0.5
• Indicated <1.0
• Inferred >1.0
This is visually appropriate and provides similar quantities to the multiple search method,
requiring two independent drill holes within 50%, 100%, and 150% of the variogram range
respectively.
6 CASE STUDY 2 – HILL TOP
The Hill Top Case Study analyzes a massive magnetite deposit in early stage exploration drilling. The deposit was discovered by aeromagnetic mapping. It is one of several hilltops in an
area containing elevated magnetic anomalies.
The empirical variogram with a range of 40 m is shown in Figure 9. Figure 10 shows the
average declustered Percent Total Iron [FeTot (%)] grade vs. the cell size. A cell size of 80 m
was chosen due to an inflection point on the cell size versus the average FeTot (%) grade
curve. Interestingly, 80 meters also happens to be double the variogram range.
Figure 11 shows the distance to the closest sample while Figure 12 shows the corresponding kriging error for a cross section of Hill Top. This study exhibits similar features to the
Middle of Nowhere case, in showing the “spotted dog” using nearest neighbor and kriging
errors respectively.
The comparison of a multiple search technique and the use of declustering weights in
Figure 13 and Figure 14 demonstrate the balancing of declustering weights with differing
sample orientations. Both methods still present broad bands of each classification related to
the average spacing.
Figure 9. Hill top empirical variogram.
Figure 10. Hill top declustering analysis.
Figure 11. Hill top nearest sample.
Figure 12. Hill top kriging error.
LaPianeha F"•TotLF-40
OmniDirectional (fetot)
"
LagDistanc•{M•IKS)
1 00
150
Call Siza (m)