

242
Turning Bands block simulations at Selective Mining Unity (SMU) level, of size
4 m × 4 m × 4 m, have been performed for 1,CoK
ˆ
Z
for each orebody taking into account the
variance of the measurement error associated with the production samples and estimated
from the kriging variance of 1,CoK
ˆ
Z
. That is to introduce the influence of production data
through their re-estimation and the use of a variance of measurement error in the Turning
Bands process. Furthermore, for post-processing, a manageable number of realizations have
been selected, characterizing the spatial variability of Cu grade in the chosen domain.
For Neves and Corvo, Table 2 presents the global statistics for Cu grade simulated (mean
of 100 realizations) from Z 1 (x) and Z 2 (x); i.e. exploration and production data with variance
of measurement error for the latter data set. Note that the statistics are presented to 1
Y Y (x)
^
and Y 2
Y Y (x)
^
back-transformed variables (step 6 of the methodology). For Neves and Corvo,
the simulated global mean and the mean of each realization are close to the mean of exploration data, Z 1 (x)
^
, and they respect the local mean.
Figures 9, 10, 11 and 12 show a part of grade tonnage curves for the 100 realizations calculated from TB conditional simulations taking into account the exploration and production
data with variance of measurement error for the latter. Through these curves, the Cu mean
grade above a given cut-off can be estimated; the same analysis can be done on the tonnage
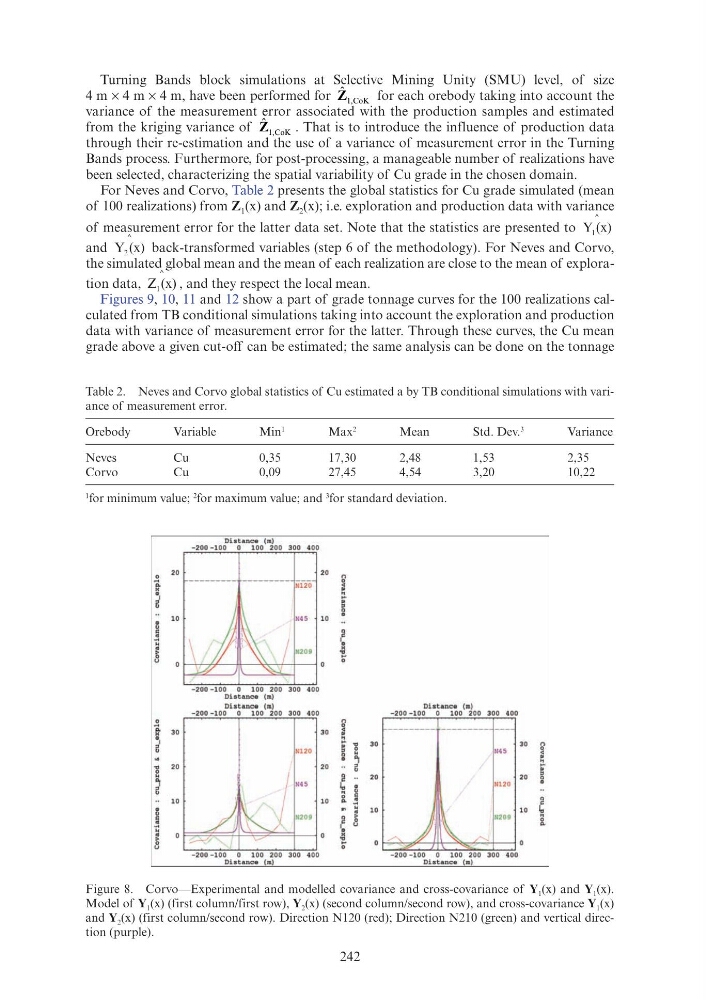
Figure 8. Corvo—Experimental and modelled covariance and cross-covariance of Y 1 (x) and Y 1 (x).
Model of Y 1 (x) (first column/first row), Y 2 (x) (second column/second row), and cross-covariance Y 1 (x)
and Y 2 (x) (first column/second row). Direction N120 (red); Direction N210 (green) and vertical direction (purple).
Table 2. Neves and Corvo global statistics of Cu estimated a by TB conditional simulations with variance of measurement error.
Orebody
Variable
Min
1
Max
2
Mean
Std. Dev.
3
Variance
Neves
Cu
0,35
17,30
2,48
1,53
2,35
Corvo
Cu
0,09
27,45
4,54
3,20
10,22
1 for minimum value;
2 for maximum value; and
3 for standard deviation.
Distance (m)
- 200 - 100
0
1 00 200 300 4 00
0
20
--------- --------~ I
B
Nl2 0
.
1 0
0
~
~
-200 - 100
0
1 00 200 300 4 00
Distance (m)
Distance (m)
- 200 - 100
0
1 00 200 300 4 00
~ 3 0
gl
Nl20
"'
20
0
~
B
1 0
0
300 400
Distance (m)
20
10
2
I
.
~
n
0
30
~· "'
2
0
~
20
B
10
2
]
p.
0
"
I
.
~
Distance (m)
- 200 -100
0
1 00 20 0 300 4 00
30
30
20
10
N4 5
N1 20
- 200 - 100
0
1 00 200 300 400
Di s tance (rn)
20
10
2
]
p.
Turning Bands block simulations at Selective Mining Unity (SMU) level, of size
4 m × 4 m × 4 m, have been performed for 1,CoK
ˆ
Z
for each orebody taking into account the
variance of the measurement error associated with the production samples and estimated
from the kriging variance of 1,CoK
ˆ
Z
. That is to introduce the influence of production data
through their re-estimation and the use of a variance of measurement error in the Turning
Bands process. Furthermore, for post-processing, a manageable number of realizations have
been selected, characterizing the spatial variability of Cu grade in the chosen domain.
For Neves and Corvo, Table 2 presents the global statistics for Cu grade simulated (mean
of 100 realizations) from Z 1 (x) and Z 2 (x); i.e. exploration and production data with variance
of measurement error for the latter data set. Note that the statistics are presented to 1
Y Y (x)
^
and Y 2
Y Y (x)
^
back-transformed variables (step 6 of the methodology). For Neves and Corvo,
the simulated global mean and the mean of each realization are close to the mean of exploration data, Z 1 (x)
^
, and they respect the local mean.
Figures 9, 10, 11 and 12 show a part of grade tonnage curves for the 100 realizations calculated from TB conditional simulations taking into account the exploration and production
data with variance of measurement error for the latter. Through these curves, the Cu mean
grade above a given cut-off can be estimated; the same analysis can be done on the tonnage
Figure 8. Corvo—Experimental and modelled covariance and cross-covariance of Y 1 (x) and Y 1 (x).
Model of Y 1 (x) (first column/first row), Y 2 (x) (second column/second row), and cross-covariance Y 1 (x)
and Y 2 (x) (first column/second row). Direction N120 (red); Direction N210 (green) and vertical direction (purple).
Table 2. Neves and Corvo global statistics of Cu estimated a by TB conditional simulations with variance of measurement error.
Orebody
Variable
Min
1
Max
2
Mean
Std. Dev.
3
Variance
Neves
Cu
0,35
17,30
2,48
1,53
2,35
Corvo
Cu
0,09
27,45
4,54
3,20
10,22
1 for minimum value;
2 for maximum value; and
3 for standard deviation.
Distance (m)
- 200 - 100
0
1 00 200 300 4 00
0
20
--------- --------~ I
B
Nl2 0
.
1 0
0
~
~
-200 - 100
0
1 00 200 300 4 00
Distance (m)
Distance (m)
- 200 - 100
0
1 00 200 300 4 00
~ 3 0
gl
Nl20
"'
20
0
~
B
1 0
0
300 400
Distance (m)
20
10
2
I
.
~
n
0
30
~· "'
2
0
~
20
B
10
2
]
p.
0
"
I
.
~
Distance (m)
- 200 -100
0
1 00 20 0 300 4 00
30
30
20
10
N4 5
N1 20
- 200 - 100
0
1 00 200 300 400
Di s tance (rn)
20
10
2
]
p.