

243
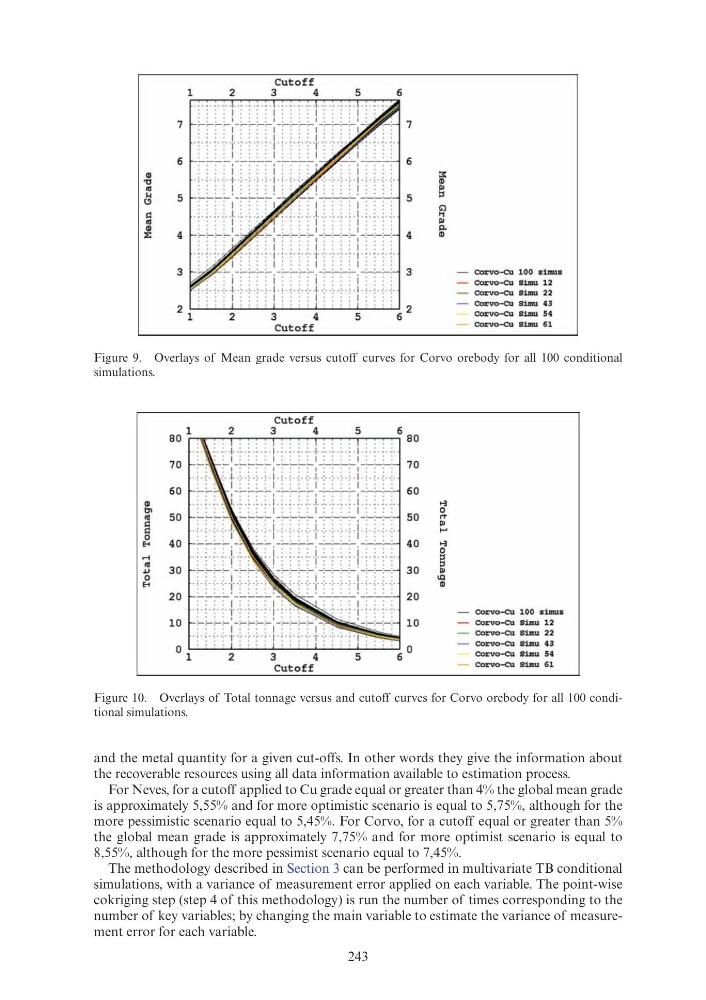
Figure 9. Overlays of Mean grade versus cutoff curves for Corvo orebody for all 100 conditional
simulations.
Figure 10. Overlays of Total tonnage versus and cutoff curves for Corvo orebody for all 100 conditional simulations.
and the metal quantity for a given cut-offs. In other words they give the information about
the recoverable resources using all data information available to estimation process.
For Neves, for a cutoff applied to Cu grade equal or greater than 4% the global mean grade
is approximately 5,55% and for more optimistic scenario is equal to 5,75%, although for the
more pessimistic scenario equal to 5,45%. For Corvo, for a cutoff equal or greater than 5%
the global mean grade is approximately 7,75% and for more optimist scenario is equal to
8,55%, although for the more pessimist scenario equal to 7,45%.
The methodology described in Section 3 can be performed in multivariate TB conditional
simulations, with a variance of measurement error applied on each variable. The point-wise
cokriging step (step 4 of this methodology) is run the number of times corresponding to the
number of key variables; by changing the main variable to estimate the variance of measurement error for each variable.
7
7
6
6
Q)
:<:
'"{j
!D
"'
P>
k
5
5
::s
t!l
Gl
~
11
"'
P>
Q)
0.
:E
4
4
!D
3
3
Cor vo-Cu 100 simus
I
I
I
Corvo-Cu Simu 1 2
c. [ . ,. : ... .. : .. [. ..· . . . . [
Cor vo-Cu Simu 22
I
I
I
2
6 2
Corvo-Cu Simu 4 3
1
2
3
4
5
Co rvo-Cu Simu 54
Cutoff
corvo-cu Simu 61
80
80
70
I
: __ : __ : _ -~. :
70
60
I
60
Q)
.: . .I. .: ... . · .. : .1
...;!
IJl
I
I
0
"'
50
50
rt"
~
_: __ [ : _ : __ : __ :_.1_:
: I
P>
~
....
0
I
I
I
E-<
40
40
...;!
I
0
.....
:
::l
"'
I
::s
.j.J
30
30
P>
0
LCI
E-<
!D
20
20
corvo-c u 100 simus
10
10
Corvo-c u Simu 1 2
Corvo-Cu Simu 22
0
0
Corvo-Cu Simu 4 3
4
5
6
Corvo-Cu Simu 54
Cutoff
Corvo-Cu Simu 61
Figure 9. Overlays of Mean grade versus cutoff curves for Corvo orebody for all 100 conditional
simulations.
Figure 10. Overlays of Total tonnage versus and cutoff curves for Corvo orebody for all 100 conditional simulations.
and the metal quantity for a given cut-offs. In other words they give the information about
the recoverable resources using all data information available to estimation process.
For Neves, for a cutoff applied to Cu grade equal or greater than 4% the global mean grade
is approximately 5,55% and for more optimistic scenario is equal to 5,75%, although for the
more pessimistic scenario equal to 5,45%. For Corvo, for a cutoff equal or greater than 5%
the global mean grade is approximately 7,75% and for more optimist scenario is equal to
8,55%, although for the more pessimist scenario equal to 7,45%.
The methodology described in Section 3 can be performed in multivariate TB conditional
simulations, with a variance of measurement error applied on each variable. The point-wise
cokriging step (step 4 of this methodology) is run the number of times corresponding to the
number of key variables; by changing the main variable to estimate the variance of measurement error for each variable.
7
7
6
6
Q)
:<:
'"{j
!D
"'
P>
k
5
5
::s
t!l
Gl
~
11
"'
P>
Q)
0.
:E
4
4
!D
3
3
Cor vo-Cu 100 simus
I
I
I
Corvo-Cu Simu 1 2
c. [ . ,. : ... .. : .. [. ..· . . . . [
Cor vo-Cu Simu 22
I
I
I
2
6 2
Corvo-Cu Simu 4 3
1
2
3
4
5
Co rvo-Cu Simu 54
Cutoff
corvo-cu Simu 61
80
80
70
I
: __ : __ : _ -~. :
70
60
I
60
Q)
.: . .I. .: ... . · .. : .1
...;!
IJl
I
I
0
"'
50
50
rt"
~
_: __ [ : _ : __ : __ :_.1_:
: I
P>
~
....
0
I
I
I
E-<
40
40
...;!
I
0
.....
:
::l
"'
I
::s
.j.J
30
30
P>
0
LCI
E-<
!D
20
20
corvo-c u 100 simus
10
10
Corvo-c u Simu 1 2
Corvo-Cu Simu 22
0
0
Corvo-Cu Simu 4 3
4
5
6
Corvo-Cu Simu 54
Cutoff
Corvo-Cu Simu 61