

237
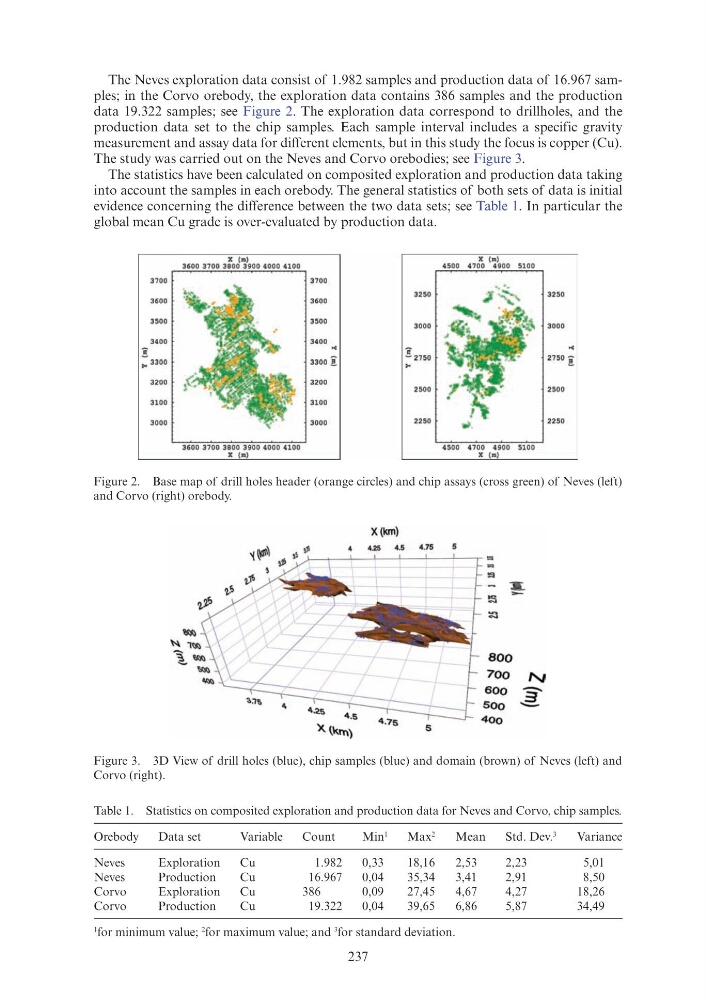
The Neves exploration data consist of 1.982 samples and production data of 16.967 samples; in the Corvo orebody, the exploration data contains 386 samples and the production
data 19.322 samples; see Figure 2. The exploration data correspond to drillholes, and the
production data set to the chip samples. Each sample interval includes a specific gravity
measurement and assay data for different elements, but in this study the focus is copper (Cu).
The study was carried out on the Neves and Corvo orebodies; see Figure 3.
The statistics have been calculated on composited exploration and production data taking
into account the samples in each orebody. The general statistics of both sets of data is initial
evidence concerning the difference between the two data sets; see Table 1. In particular the
global mean Cu grade is over-evaluated by production data.
Figure 2. Base map of drill holes header (orange circles) and chip assays (cross green) of Neves (left)
and Corvo (right) orebody.
Figure 3. 3D View of drill holes (blue), chip samples (blue) and domain (brown) of Neves (left) and
Corvo (right).
Table 1. Statistics on composited exploration and production data for Neves and Corvo, chip samples.
Orebody
Data set
Variable
Count
Min
1
Max
2
Mean
Std. Dev.
3
Variance
Neves
Exploration
Cu
1.982
0,33
18,16
2,53
2,23
5,01
Neves
Production
Cu
16.967
0,04
35,34
3,41
2,91
8,50
Corvo
Exploration
Cu
386
0,09
27,45
4,67
4,27
18,26
Corvo
Production
Cu
19.322
0,04
39,65
6,86
5,87
34,49
1
for minimum value;
2 for maximum value; and
3 for standard deviation.
X (m)
X ( m)
3600 3700 3800 3900 4000 4 100
4500 47 00 4900 5 1 0 0
370 0
3700
3250
3 2 50
3600
3600
3500
3500
3000
3 000
3400
3400
~
~
•
::-- 3300
3300 :!
~ 2 750
2 750 ~
,..
320 0
3200
250 0
2500
3 100
3100
3000
3000
2250
W>.
2250
3600 3700 3800 3900 4000 4 1 00
4500 47 0 0 4900 5 1 00
X (m)
X (m)
X (km)
4.25
4.5
4.75
"'
""
!S
~
~
BOO
700 N
600
3'
soo
-
5
40o
The Neves exploration data consist of 1.982 samples and production data of 16.967 samples; in the Corvo orebody, the exploration data contains 386 samples and the production
data 19.322 samples; see Figure 2. The exploration data correspond to drillholes, and the
production data set to the chip samples. Each sample interval includes a specific gravity
measurement and assay data for different elements, but in this study the focus is copper (Cu).
The study was carried out on the Neves and Corvo orebodies; see Figure 3.
The statistics have been calculated on composited exploration and production data taking
into account the samples in each orebody. The general statistics of both sets of data is initial
evidence concerning the difference between the two data sets; see Table 1. In particular the
global mean Cu grade is over-evaluated by production data.
Figure 2. Base map of drill holes header (orange circles) and chip assays (cross green) of Neves (left)
and Corvo (right) orebody.
Figure 3. 3D View of drill holes (blue), chip samples (blue) and domain (brown) of Neves (left) and
Corvo (right).
Table 1. Statistics on composited exploration and production data for Neves and Corvo, chip samples.
Orebody
Data set
Variable
Count
Min
1
Max
2
Mean
Std. Dev.
3
Variance
Neves
Exploration
Cu
1.982
0,33
18,16
2,53
2,23
5,01
Neves
Production
Cu
16.967
0,04
35,34
3,41
2,91
8,50
Corvo
Exploration
Cu
386
0,09
27,45
4,67
4,27
18,26
Corvo
Production
Cu
19.322
0,04
39,65
6,86
5,87
34,49
1
for minimum value;
2 for maximum value; and
3 for standard deviation.
X (m)
X ( m)
3600 3700 3800 3900 4000 4 100
4500 47 00 4900 5 1 0 0
370 0
3700
3250
3 2 50
3600
3600
3500
3500
3000
3 000
3400
3400
~
~
•
::-- 3300
3300 :!
~ 2 750
2 750 ~
,..
320 0
3200
250 0
2500
3 100
3100
3000
3000
2250
W>.
2250
3600 3700 3800 3900 4000 4 1 00
4500 47 0 0 4900 5 1 00
X (m)
X (m)
X (km)
4.25
4.5
4.75
"'
""
!S
~
~
BOO
700 N
600
3'
soo
-
5
40o