

230
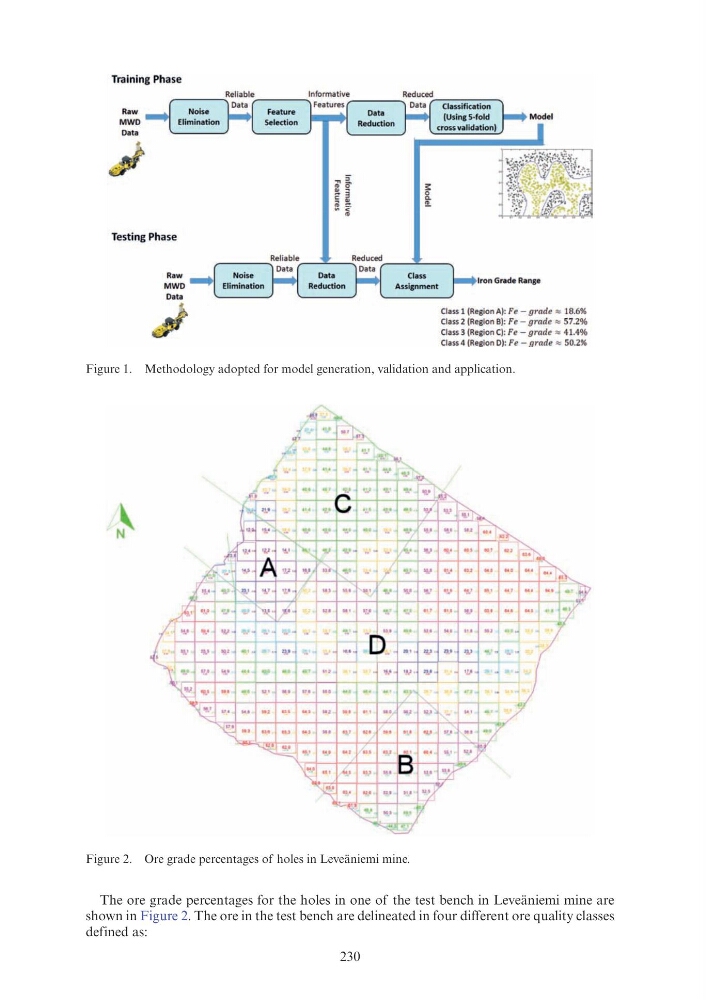
Figure 1. Methodology adopted for model generation, validation and application.
Figure 2. Ore grade percentages of holes in Leveäniemi mine.
The ore grade percentages for the holes in one of the test bench in Leveäniemi mine are
shown in Figure 2. The ore in the test bench are delineated in four different ore quality classes
defined as:
Training Phase
Raw
MWD
Data
Testing Phase
Raw . . . .
MWD
Data
Feature
Selection
Iron Grade Range
Class 1 (Region A): Fe- grade "' 18.6%
Class 2 (Region B): Fe- grade "' 57.2%
Class 3 (Region C): Fe - grade "' 41.4%
Class 4 (Region D): Fe - gr ade ~ 50.2%
fi~~
:: .:± :~
. ,;f .• -
'"' '" ~ ·~ 'A ' '!.' ~
~~· : . : :: ~· : : : . : ~ : : :. ~ ( ::~~"' I · . .
):' ., . . '<'· "'' ~ . ... . ~ .. - ,,_, ~~-· ...., ""' ... ., '" f~· .
~~'\' ~~ I ~ IY · ~~-; " ' K'' •. : . • f "!. -' • %,1 ·~ .. • IU IU 140 , ... .. . fl.
. . ... ... . ... ... . . . . . . . .. I ... i · -~ "'
-D. . t-,-,-. J- ~-j-,. -, -. t-'1..- ,-+ oM,r .. 1
q,.s 'j liD ~w 1
Figure 1. Methodology adopted for model generation, validation and application.
Figure 2. Ore grade percentages of holes in Leveäniemi mine.
The ore grade percentages for the holes in one of the test bench in Leveäniemi mine are
shown in Figure 2. The ore in the test bench are delineated in four different ore quality classes
defined as:
Training Phase
Raw
MWD
Data
Testing Phase
Raw . . . .
MWD
Data
Feature
Selection
Iron Grade Range
Class 1 (Region A): Fe- grade "' 18.6%
Class 2 (Region B): Fe- grade "' 57.2%
Class 3 (Region C): Fe - grade "' 41.4%
Class 4 (Region D): Fe - gr ade ~ 50.2%
fi~~
:: .:± :~
. ,;f .• -
'"' '" ~ ·~ 'A ' '!.' ~
~~· : . : :: ~· : : : . : ~ : : :. ~ ( ::~~"' I · . .
):' ., . . '<'· "'' ~ . ... . ~ .. - ,,_, ~~-· ...., ""' ... ., '" f~· .
~~'\' ~~ I ~ IY · ~~-; " ' K'' •. : . • f "!. -' • %,1 ·~ .. • IU IU 140 , ... .. . fl.
. . ... ... . ... ... . . . . . . . .. I ... i · -~ "'
-D. . t-,-,-. J- ~-j-,. -, -. t-'1..- ,-+ oM,r .. 1
q,.s 'j liD ~w 1