

224
This is followed by a decrease in penetration rate to a depth of 14 m due to the underlying
hard or competent rock. At the lower part of the bench face, there is a highly fractured and
broken rock mass which causes an increase in penetration rate as well as an increase in rotation pressure in MWD data, as the drill bit has a tendency to stall in such rock conditions.
The last part of the MWD data cannot be seen in the image because of the loose material at
the toe of the bench face and sub-drilling.
6 CONCLUSION
Results of MWD data and CRTDP data are in close agreement. A higher penetration rate
suggests a weaker rock mass and vice versa. A sudden increase in penetration rate suggests
the presence of an open joint as closed fractures or joints don’t cause the sudden variations
seen in the results. Higher rotation pressure suggests a highly fractured or broken rock mass
with higher resistance for the bit to rotate. Findings show that the MWD data variations can
be used to predict the nature of the rock mass, and this information can be used to optimize
the blast design. This will reduce the consumption of explosives in weaker rock mass and
improve the stability of the remaining wall by reducing the back break effects.
ACKNOWLEDGMENTS
This work is a part of the SLIM project for ‘Sustainable Low Impact Mining’ funded by
the European Union. The authors acknowledge VA Erzberg, Austria, especially Dr. Peter
Schimek for the data support. We would also like to thank Thomas Seidl, Montanuniversitaet, Leoben for his support during data acquisition and interpretation.
REFERENCES
3GSM, 2010. ShapeMetriX 3D, User Manual. Graz: 3G Software and Measurement GmbH.
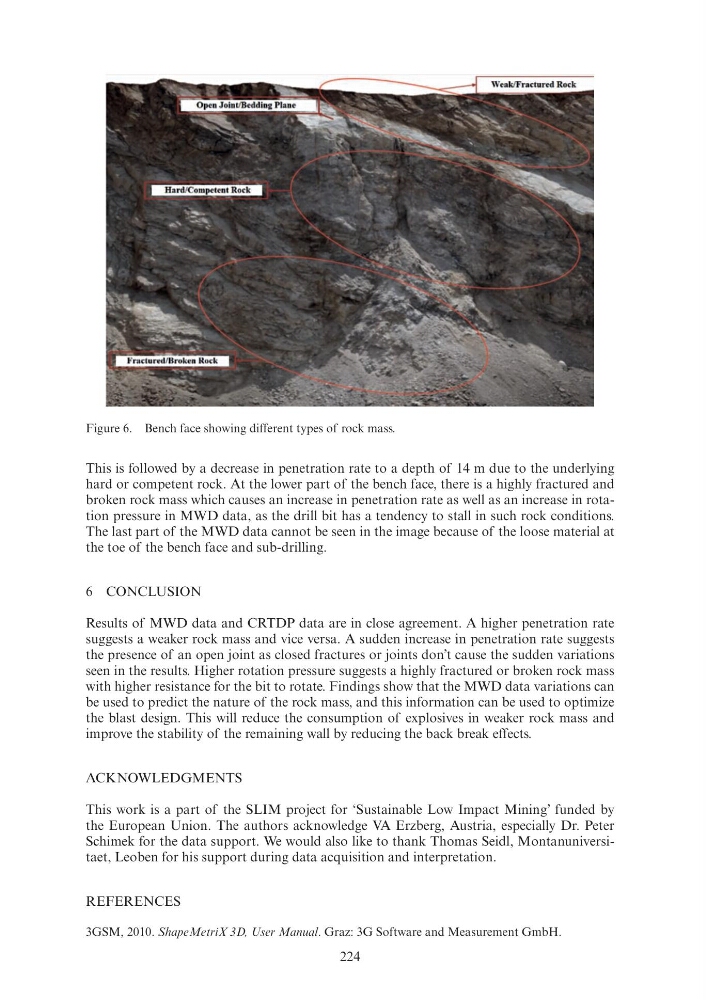
Figure 6. Bench face showing different types of rock mass.
This is followed by a decrease in penetration rate to a depth of 14 m due to the underlying
hard or competent rock. At the lower part of the bench face, there is a highly fractured and
broken rock mass which causes an increase in penetration rate as well as an increase in rotation pressure in MWD data, as the drill bit has a tendency to stall in such rock conditions.
The last part of the MWD data cannot be seen in the image because of the loose material at
the toe of the bench face and sub-drilling.
6 CONCLUSION
Results of MWD data and CRTDP data are in close agreement. A higher penetration rate
suggests a weaker rock mass and vice versa. A sudden increase in penetration rate suggests
the presence of an open joint as closed fractures or joints don’t cause the sudden variations
seen in the results. Higher rotation pressure suggests a highly fractured or broken rock mass
with higher resistance for the bit to rotate. Findings show that the MWD data variations can
be used to predict the nature of the rock mass, and this information can be used to optimize
the blast design. This will reduce the consumption of explosives in weaker rock mass and
improve the stability of the remaining wall by reducing the back break effects.
ACKNOWLEDGMENTS
This work is a part of the SLIM project for ‘Sustainable Low Impact Mining’ funded by
the European Union. The authors acknowledge VA Erzberg, Austria, especially Dr. Peter
Schimek for the data support. We would also like to thank Thomas Seidl, Montanuniversitaet, Leoben for his support during data acquisition and interpretation.
REFERENCES
3GSM, 2010. ShapeMetriX 3D, User Manual. Graz: 3G Software and Measurement GmbH.
Figure 6. Bench face showing different types of rock mass.