

223
− Open joints
− Fractured or broken rock
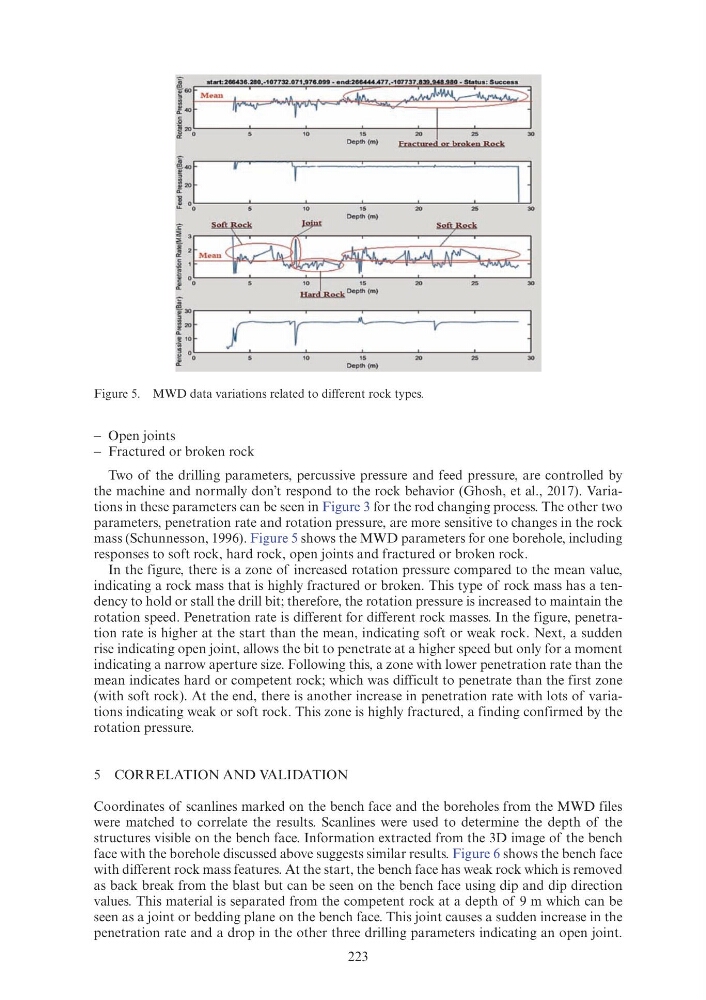
Two of the drilling parameters, percussive pressure and feed pressure, are controlled by
the machine and normally don’t respond to the rock behavior (Ghosh, et al., 2017). Variations in these parameters can be seen in Figure 3 for the rod changing process. The other two
parameters, penetration rate and rotation pressure, are more sensitive to changes in the rock
mass (Schunnesson, 1996). Figure 5 shows the MWD parameters for one borehole, including
responses to soft rock, hard rock, open joints and fractured or broken rock.
In the figure, there is a zone of increased rotation pressure compared to the mean value,
indicating a rock mass that is highly fractured or broken. This type of rock mass has a tendency to hold or stall the drill bit; therefore, the rotation pressure is increased to maintain the
rotation speed. Penetration rate is different for different rock masses. In the figure, penetration rate is higher at the start than the mean, indicating soft or weak rock. Next, a sudden
rise indicating open joint, allows the bit to penetrate at a higher speed but only for a moment
indicating a narrow aperture size. Following this, a zone with lower penetration rate than the
mean indicates hard or competent rock; which was difficult to penetrate than the first zone
(with soft rock). At the end, there is another increase in penetration rate with lots of variations indicating weak or soft rock. This zone is highly fractured, a finding confirmed by the
rotation pressure.
5 CORRELATION AND VALIDATION
Coordinates of scanlines marked on the bench face and the boreholes from the MWD files
were matched to correlate the results. Scanlines were used to determine the depth of the
structures visible on the bench face. Information extracted from the 3D image of the bench
face with the borehole discussed above suggests similar results. Figure 6 shows the bench face
with different rock mass features. At the start, the bench face has weak rock which is removed
as back break from the blast but can be seen on the bench face using dip and dip direction
values. This material is separated from the competent rock at a depth of 9 m which can be
seen as a joint or bedding plane on the bench face. This joint causes a sudden increase in the
penetration rate and a drop in the other three drilling parameters indicating an open joint.
Figure 5. MWD data variations related to different rock types.
f:f ' r
11
~ .~--------~--------~1.~------~1~5--------~~~------~~=-------~~
hM•~:~ 4 ~ l
~·
5
~ 15
~
~
~
_
Hard Rock Depth (m)
t~tt:: ~:
~ 0
10
15
Oepth(m)
l
− Open joints
− Fractured or broken rock
Two of the drilling parameters, percussive pressure and feed pressure, are controlled by
the machine and normally don’t respond to the rock behavior (Ghosh, et al., 2017). Variations in these parameters can be seen in Figure 3 for the rod changing process. The other two
parameters, penetration rate and rotation pressure, are more sensitive to changes in the rock
mass (Schunnesson, 1996). Figure 5 shows the MWD parameters for one borehole, including
responses to soft rock, hard rock, open joints and fractured or broken rock.
In the figure, there is a zone of increased rotation pressure compared to the mean value,
indicating a rock mass that is highly fractured or broken. This type of rock mass has a tendency to hold or stall the drill bit; therefore, the rotation pressure is increased to maintain the
rotation speed. Penetration rate is different for different rock masses. In the figure, penetration rate is higher at the start than the mean, indicating soft or weak rock. Next, a sudden
rise indicating open joint, allows the bit to penetrate at a higher speed but only for a moment
indicating a narrow aperture size. Following this, a zone with lower penetration rate than the
mean indicates hard or competent rock; which was difficult to penetrate than the first zone
(with soft rock). At the end, there is another increase in penetration rate with lots of variations indicating weak or soft rock. This zone is highly fractured, a finding confirmed by the
rotation pressure.
5 CORRELATION AND VALIDATION
Coordinates of scanlines marked on the bench face and the boreholes from the MWD files
were matched to correlate the results. Scanlines were used to determine the depth of the
structures visible on the bench face. Information extracted from the 3D image of the bench
face with the borehole discussed above suggests similar results. Figure 6 shows the bench face
with different rock mass features. At the start, the bench face has weak rock which is removed
as back break from the blast but can be seen on the bench face using dip and dip direction
values. This material is separated from the competent rock at a depth of 9 m which can be
seen as a joint or bedding plane on the bench face. This joint causes a sudden increase in the
penetration rate and a drop in the other three drilling parameters indicating an open joint.
Figure 5. MWD data variations related to different rock types.
f:f ' r
11
~ .~--------~--------~1.~------~1~5--------~~~------~~=-------~~
hM•~:~ 4 ~ l
~·
5
~ 15
~
~
~
_
Hard Rock Depth (m)
t~tt:: ~:
~ 0
10
15
Oepth(m)
l