

207
even when they are used, the geostatistical methods also include assumptions on geometric
parameters.
3.3 Geometric techniques applied in the reports
Considering the details of the survey, no single technique was considered for a specific type
of deposit, as the various project QPs made different assumptions for same type of deposits.
Most of the companies used different classification parameters or requirements for similar
type of deposit in different locations, as shown in Table 6. From the survey on the technical
reports, only two companies followed a consistent classification method for all its deposits,
regardless of the jurisdiction.
3.4 Discussion
The research has shown that the gold mining industry players prefer the geometric method,
since few reports applied geostatistical methods for classification. The geometric method is
simple and faster to apply. Hence, there is the need to research into generation of an easier
and timely geostatistical classification framework to attract the interest of the gold industry players. A good and reliable resource estimation is important in the mineral extractive
industry. During the survey, it was observed that different QPs applied different interpolation
approaches on same type of deposit. Different grade capping approaches were applied by different QPs. These included capping before compositing, capping after compositing, capping
per geological domain, and average capping value for all geological domains. Each capping
approach can lead to variation of the average grade of a deposit. Different block modeling
approaches were identified in the survey. These included single block model for surface and
underground operations of same deposit, multiple block models for surface and underground operations of same deposit, different block models for different geological domains,
and same block model for different geological domains. Also, an estimation pass for mineral
resource classification is very crucial in predicting blocks that belong to Measured, Indicated
and Inferred categories. In the survey, different QPs from same mining company applied different assumptions for similar type of deposits. There was no consistency in the creation of
the parameters used for estimation passes for classification.
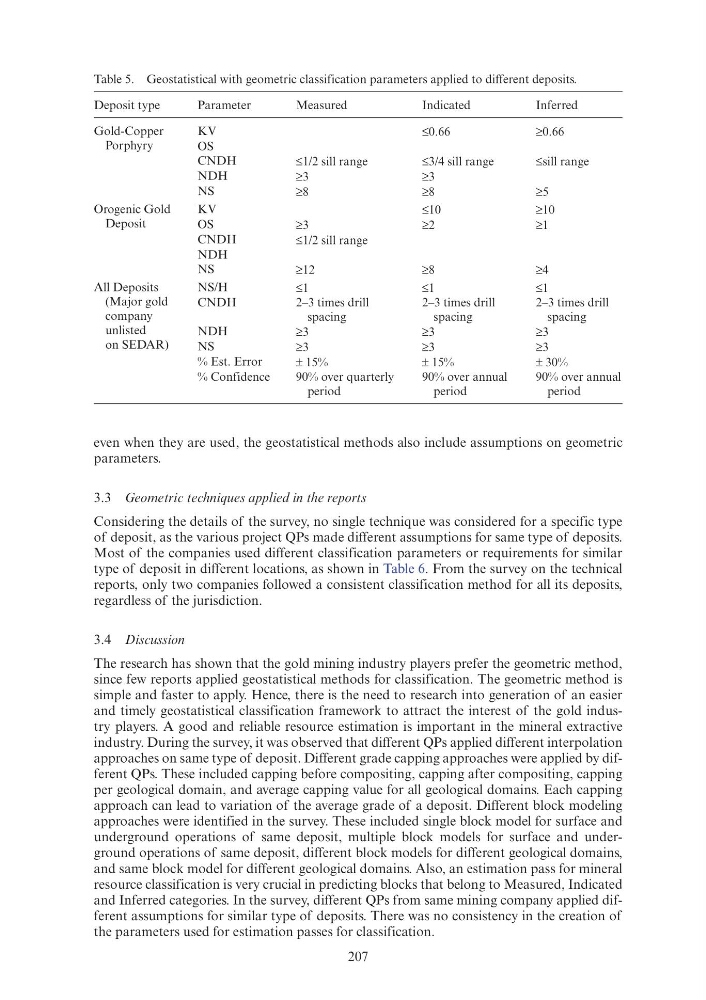
Table 5. Geostatistical with geometric classification parameters applied to different deposits.
Deposit type
Parameter
Measured
Indicated
Inferred
Gold-Copper
Porphyry
KV
≤0.66
≥0.66
OS
CNDH
≤1/2 sill range
≤3/4 sill range
≤sill range
NDH
≥3
≥3
NS
≥8
≥8
≥5
Orogenic Gold
Deposit
KV
≤10
≥10
OS
≥3
≥2
≥1
CNDH
≤1/2 sill range
NDH
NS
≥12
≥8
≥4
All Deposits
(Major gold
company
unlisted
on SEDAR)
NS/H
≤1
≤1
≤1
CNDH
2–3 times drill
spacing
2–3 times drill
spacing
2–3 times drill
spacing
NDH
≥3
≥3
≥3
NS
≥3
≥3
≥3
% Est. Error
± 15%
± 15%
± 30%
% Confidence
90% over quarterly
period
90% over annual
period
90% over annual
period
even when they are used, the geostatistical methods also include assumptions on geometric
parameters.
3.3 Geometric techniques applied in the reports
Considering the details of the survey, no single technique was considered for a specific type
of deposit, as the various project QPs made different assumptions for same type of deposits.
Most of the companies used different classification parameters or requirements for similar
type of deposit in different locations, as shown in Table 6. From the survey on the technical
reports, only two companies followed a consistent classification method for all its deposits,
regardless of the jurisdiction.
3.4 Discussion
The research has shown that the gold mining industry players prefer the geometric method,
since few reports applied geostatistical methods for classification. The geometric method is
simple and faster to apply. Hence, there is the need to research into generation of an easier
and timely geostatistical classification framework to attract the interest of the gold industry players. A good and reliable resource estimation is important in the mineral extractive
industry. During the survey, it was observed that different QPs applied different interpolation
approaches on same type of deposit. Different grade capping approaches were applied by different QPs. These included capping before compositing, capping after compositing, capping
per geological domain, and average capping value for all geological domains. Each capping
approach can lead to variation of the average grade of a deposit. Different block modeling
approaches were identified in the survey. These included single block model for surface and
underground operations of same deposit, multiple block models for surface and underground operations of same deposit, different block models for different geological domains,
and same block model for different geological domains. Also, an estimation pass for mineral
resource classification is very crucial in predicting blocks that belong to Measured, Indicated
and Inferred categories. In the survey, different QPs from same mining company applied different assumptions for similar type of deposits. There was no consistency in the creation of
the parameters used for estimation passes for classification.
Table 5. Geostatistical with geometric classification parameters applied to different deposits.
Deposit type
Parameter
Measured
Indicated
Inferred
Gold-Copper
Porphyry
KV
≤0.66
≥0.66
OS
CNDH
≤1/2 sill range
≤3/4 sill range
≤sill range
NDH
≥3
≥3
NS
≥8
≥8
≥5
Orogenic Gold
Deposit
KV
≤10
≥10
OS
≥3
≥2
≥1
CNDH
≤1/2 sill range
NDH
NS
≥12
≥8
≥4
All Deposits
(Major gold
company
unlisted
on SEDAR)
NS/H
≤1
≤1
≤1
CNDH
2–3 times drill
spacing
2–3 times drill
spacing
2–3 times drill
spacing
NDH
≥3
≥3
≥3
NS
≥3
≥3
≥3
% Est. Error
± 15%
± 15%
± 30%
% Confidence
90% over quarterly
period
90% over annual
period
90% over annual
period