

208
4 CONCLUSION
The investigation has served as a basis for identifying how different Qualified Persons apply
different assumptions and approaches to categorize mineral resources into measured, indicated, and inferred in the gold mineral industry. The various mining companies considered
in this survey did not apply consistent parameters for their estimation and classification
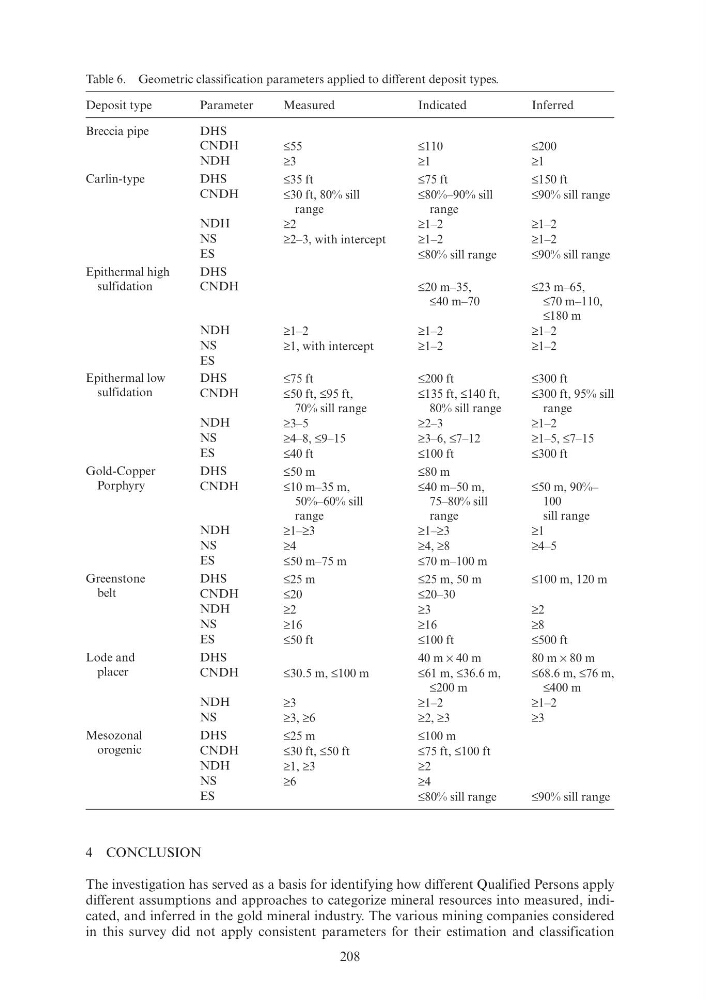
Table 6. Geometric classification parameters applied to different deposit types.
Deposit type
Parameter
Measured
Indicated
Inferred
Breccia pipe
DHS
CNDH
≤55
≤110
≤200
NDH
≥3
≥1
≥1
Carlin-type
DHS
≤35 ft
≤75 ft
≤150 ft
CNDH
≤30 ft, 80% sill
range
≤80%–90% sill
range
≤90% sill range
NDH
≥2
≥1–2
≥1–2
NS
≥2–3, with intercept
≥1–2
≥1–2
ES
≤80% sill range
≤90% sill range
Epithermal high
sulfidation
DHS
CNDH
≤20 m–35,
≤40 m–70
≤23 m–65,
≤70 m–110,
≤180 m
NDH
≥1–2
≥1–2
≥1–2
NS
≥1, with intercept
≥1–2
≥1–2
ES
Epithermal low
sulfidation
DHS
≤75 ft
≤200 ft
≤300 ft
CNDH
≤50 ft, ≤95 ft,
70% sill range
≤135 ft, ≤140 ft,
80% sill range
≤300 ft, 95% sill
range
NDH
≥3–5
≥2–3
≥1–2
NS
≥4–8, ≤9–15
≥3–6, ≤7–12
≥1–5, ≤7–15
ES
≤40 ft
≤100 ft
≤300 ft
Gold-Copper
Porphyry
DHS
≤50 m
≤80 m
CNDH
≤10 m–35 m,
50%–60% sill
range
≤40 m–50 m,
75–80% sill
range
≤50 m, 90%–
100
sill range
NDH
≥1–≥3
≥1–≥3
≥1
NS
≥4
≥4, ≥8
≥4–5
ES
≤50 m–75 m
≤70 m–100 m
Greenstone
belt
DHS
≤25 m
≤25 m, 50 m
≤100 m, 120 m
CNDH
≤20
≤20–30
NDH
≥2
≥3
≥2
NS
≥16
≥16
≥8
ES
≤50 ft
≤100 ft
≤500 ft
Lode and
placer
DHS
40 m × 40 m
80 m × 80 m
CNDH
≤30.5 m, ≤100 m
≤61 m, ≤36.6 m,
≤200 m
≤68.6 m, ≤76 m,
≤400 m
NDH
≥3
≥1–2
≥1–2
NS
≥3, ≥6
≥2, ≥3
≥3
Mesozonal
orogenic
DHS
≤25 m
≤100 m
CNDH
≤30 ft, ≤50 ft
≤75 ft, ≤100 ft
NDH
≥1, ≥3
≥2
NS
≥6
≥4
ES
≤80% sill range
≤90% sill range
4 CONCLUSION
The investigation has served as a basis for identifying how different Qualified Persons apply
different assumptions and approaches to categorize mineral resources into measured, indicated, and inferred in the gold mineral industry. The various mining companies considered
in this survey did not apply consistent parameters for their estimation and classification
Table 6. Geometric classification parameters applied to different deposit types.
Deposit type
Parameter
Measured
Indicated
Inferred
Breccia pipe
DHS
CNDH
≤55
≤110
≤200
NDH
≥3
≥1
≥1
Carlin-type
DHS
≤35 ft
≤75 ft
≤150 ft
CNDH
≤30 ft, 80% sill
range
≤80%–90% sill
range
≤90% sill range
NDH
≥2
≥1–2
≥1–2
NS
≥2–3, with intercept
≥1–2
≥1–2
ES
≤80% sill range
≤90% sill range
Epithermal high
sulfidation
DHS
CNDH
≤20 m–35,
≤40 m–70
≤23 m–65,
≤70 m–110,
≤180 m
NDH
≥1–2
≥1–2
≥1–2
NS
≥1, with intercept
≥1–2
≥1–2
ES
Epithermal low
sulfidation
DHS
≤75 ft
≤200 ft
≤300 ft
CNDH
≤50 ft, ≤95 ft,
70% sill range
≤135 ft, ≤140 ft,
80% sill range
≤300 ft, 95% sill
range
NDH
≥3–5
≥2–3
≥1–2
NS
≥4–8, ≤9–15
≥3–6, ≤7–12
≥1–5, ≤7–15
ES
≤40 ft
≤100 ft
≤300 ft
Gold-Copper
Porphyry
DHS
≤50 m
≤80 m
CNDH
≤10 m–35 m,
50%–60% sill
range
≤40 m–50 m,
75–80% sill
range
≤50 m, 90%–
100
sill range
NDH
≥1–≥3
≥1–≥3
≥1
NS
≥4
≥4, ≥8
≥4–5
ES
≤50 m–75 m
≤70 m–100 m
Greenstone
belt
DHS
≤25 m
≤25 m, 50 m
≤100 m, 120 m
CNDH
≤20
≤20–30
NDH
≥2
≥3
≥2
NS
≥16
≥16
≥8
ES
≤50 ft
≤100 ft
≤500 ft
Lode and
placer
DHS
40 m × 40 m
80 m × 80 m
CNDH
≤30.5 m, ≤100 m
≤61 m, ≤36.6 m,
≤200 m
≤68.6 m, ≤76 m,
≤400 m
NDH
≥3
≥1–2
≥1–2
NS
≥3, ≥6
≥2, ≥3
≥3
Mesozonal
orogenic
DHS
≤25 m
≤100 m
CNDH
≤30 ft, ≤50 ft
≤75 ft, ≤100 ft
NDH
≥1, ≥3
≥2
NS
≥6
≥4
ES
≤80% sill range
≤90% sill range