

206
assumptions made by different QPs lead to potential discrepancies in public reporting of
mineral resources. A gold deposit categorized by QP-A as measured may not pass the classification test for inferred by QP-B. In the public domain, it is difficult for investors to justify
the correct reports from the misleading ones. The current industry practices lack consistency,
resulting in various forms of implications, hence the need for the development of more formal methods.
3.2 Geostatistical techniques applied in the reports
Although geostatistical methods are considered to be providing the best techniques available
to model geologic and grade uncertainty in mineral deposits, it is evident from the survey
and from Table 5, that the industry professionals do not commonly use these methods and
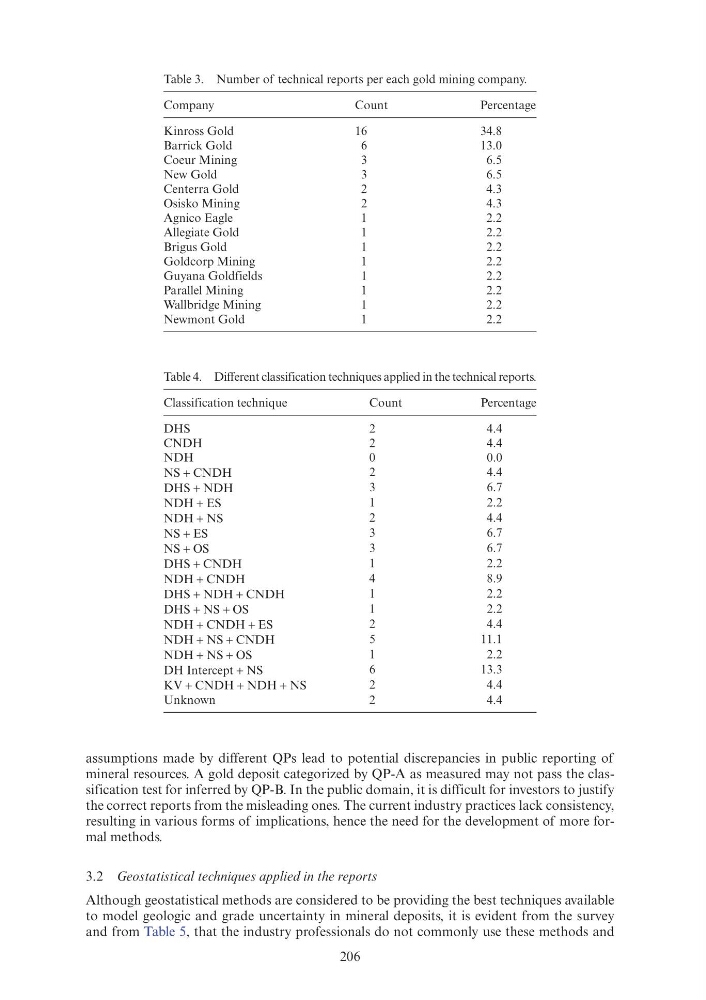
Table 3. Number of technical reports per each gold mining company.
Company
Count
Percentage
Kinross Gold
16
34.8
Barrick Gold
6
13.0
Coeur Mining
3
6.5
New Gold
3
6.5
Centerra Gold
2
4.3
Osisko Mining
2
4.3
Agnico Eagle
1
2.2
Allegiate Gold
1
2.2
Brigus Gold
1
2.2
Goldcorp Mining
1
2.2
Guyana Goldfields
1
2.2
Parallel Mining
1
2.2
Wallbridge Mining
1
2.2
Newmont Gold
1
2.2
Table 4. Different classification techniques applied in the technical reports.
Classification technique
Count
Percentage
DHS
2
4.4
CNDH
2
4.4
NDH
0
0.0
NS + CNDH
2
4.4
DHS + NDH
3
6.7
NDH + ES
1
2.2
NDH + NS
2
4.4
NS + ES
3
6.7
NS + OS
3
6.7
DHS + CNDH
1
2.2
NDH + CNDH
4
8.9
DHS + NDH + CNDH
1
2.2
DHS + NS + OS
1
2.2
NDH + CNDH + ES
2
4.4
NDH + NS + CNDH
5
11.1
NDH + NS + OS
1
2.2
DH Intercept + NS
6
13.3
KV + CNDH + NDH + NS
2
4.4
Unknown
2
4.4
assumptions made by different QPs lead to potential discrepancies in public reporting of
mineral resources. A gold deposit categorized by QP-A as measured may not pass the classification test for inferred by QP-B. In the public domain, it is difficult for investors to justify
the correct reports from the misleading ones. The current industry practices lack consistency,
resulting in various forms of implications, hence the need for the development of more formal methods.
3.2 Geostatistical techniques applied in the reports
Although geostatistical methods are considered to be providing the best techniques available
to model geologic and grade uncertainty in mineral deposits, it is evident from the survey
and from Table 5, that the industry professionals do not commonly use these methods and
Table 3. Number of technical reports per each gold mining company.
Company
Count
Percentage
Kinross Gold
16
34.8
Barrick Gold
6
13.0
Coeur Mining
3
6.5
New Gold
3
6.5
Centerra Gold
2
4.3
Osisko Mining
2
4.3
Agnico Eagle
1
2.2
Allegiate Gold
1
2.2
Brigus Gold
1
2.2
Goldcorp Mining
1
2.2
Guyana Goldfields
1
2.2
Parallel Mining
1
2.2
Wallbridge Mining
1
2.2
Newmont Gold
1
2.2
Table 4. Different classification techniques applied in the technical reports.
Classification technique
Count
Percentage
DHS
2
4.4
CNDH
2
4.4
NDH
0
0.0
NS + CNDH
2
4.4
DHS + NDH
3
6.7
NDH + ES
1
2.2
NDH + NS
2
4.4
NS + ES
3
6.7
NS + OS
3
6.7
DHS + CNDH
1
2.2
NDH + CNDH
4
8.9
DHS + NDH + CNDH
1
2.2
DHS + NS + OS
1
2.2
NDH + CNDH + ES
2
4.4
NDH + NS + CNDH
5
11.1
NDH + NS + OS
1
2.2
DH Intercept + NS
6
13.3
KV + CNDH + NDH + NS
2
4.4
Unknown
2
4.4