

205
the tables are; Drill Hole Spacing (DHS), Distance to Nearest Drill Hole (DNDH), Number
of Samples (NS), Number of Drill Holes (NDH), Ellipsoidal Search (ES), Octant Search
(OS), Drill Hole Intercept (DH Intercept), and Kriging Variance (KV).
Generally, the parameters used differed even in the case of same type of deposit. For
example, using the variogram range as a measure of search neighborhood, companies used
different percentages of the variogram range, for example, 95%, 90%, 80%, etc. After critical
study of the table and realizing different parameters used, one can conclude that different
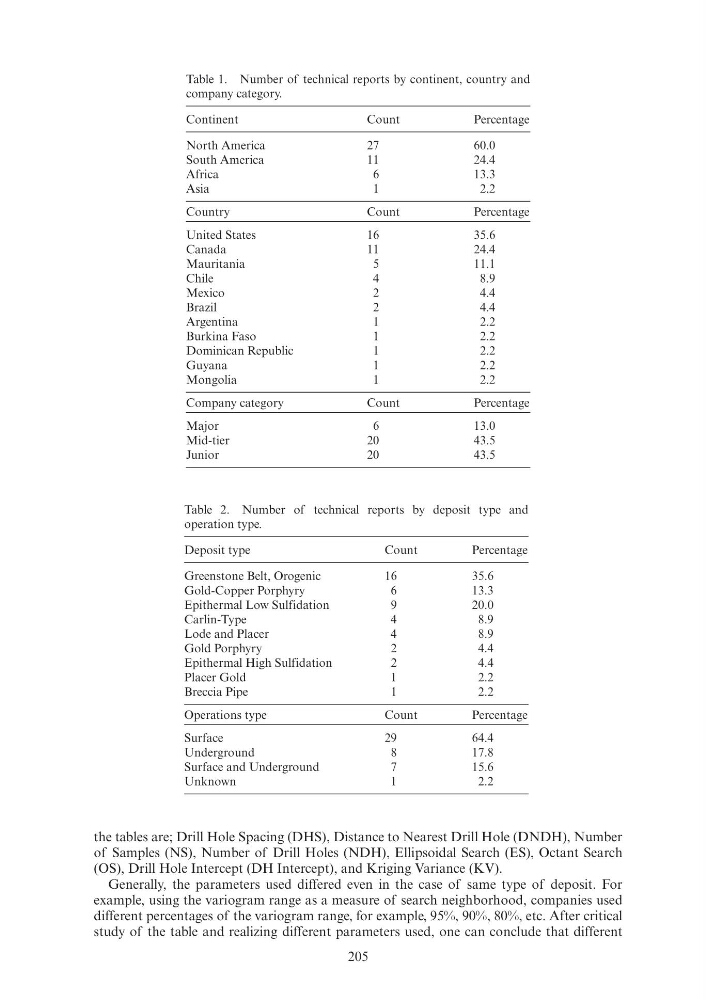
Table 1. Number of technical reports by continent, country and
company category.
Continent
Count
Percentage
North America
27
60.0
South America
11
24.4
Africa
6
13.3
Asia
1
2.2
Country
Count
Percentage
United States
16
35.6
Canada
11
24.4
Mauritania
5
11.1
Chile
4
8.9
Mexico
2
4.4
Brazil
2
4.4
Argentina
1
2.2
Burkina Faso
1
2.2
Dominican Republic
1
2.2
Guyana
1
2.2
Mongolia
1
2.2
Company category
Count
Percentage
Major
6
13.0
Mid-tier
20
43.5
Junior
20
43.5
Table 2. Number of technical reports by deposit type and
operation type.
Deposit type
Count
Percentage
Greenstone Belt, Orogenic
16
35.6
Gold-Copper Porphyry
6
13.3
Epithermal Low Sulfidation
9
20.0
Carlin-Type
4
8.9
Lode and Placer
4
8.9
Gold Porphyry
2
4.4
Epithermal High Sulfidation
2
4.4
Placer Gold
1
2.2
Breccia Pipe
1
2.2
Operations type
Count
Percentage
Surface
29
64.4
Underground
8
17.8
Surface and Underground
7
15.6
Unknown
1
2.2
the tables are; Drill Hole Spacing (DHS), Distance to Nearest Drill Hole (DNDH), Number
of Samples (NS), Number of Drill Holes (NDH), Ellipsoidal Search (ES), Octant Search
(OS), Drill Hole Intercept (DH Intercept), and Kriging Variance (KV).
Generally, the parameters used differed even in the case of same type of deposit. For
example, using the variogram range as a measure of search neighborhood, companies used
different percentages of the variogram range, for example, 95%, 90%, 80%, etc. After critical
study of the table and realizing different parameters used, one can conclude that different
Table 1. Number of technical reports by continent, country and
company category.
Continent
Count
Percentage
North America
27
60.0
South America
11
24.4
Africa
6
13.3
Asia
1
2.2
Country
Count
Percentage
United States
16
35.6
Canada
11
24.4
Mauritania
5
11.1
Chile
4
8.9
Mexico
2
4.4
Brazil
2
4.4
Argentina
1
2.2
Burkina Faso
1
2.2
Dominican Republic
1
2.2
Guyana
1
2.2
Mongolia
1
2.2
Company category
Count
Percentage
Major
6
13.0
Mid-tier
20
43.5
Junior
20
43.5
Table 2. Number of technical reports by deposit type and
operation type.
Deposit type
Count
Percentage
Greenstone Belt, Orogenic
16
35.6
Gold-Copper Porphyry
6
13.3
Epithermal Low Sulfidation
9
20.0
Carlin-Type
4
8.9
Lode and Placer
4
8.9
Gold Porphyry
2
4.4
Epithermal High Sulfidation
2
4.4
Placer Gold
1
2.2
Breccia Pipe
1
2.2
Operations type
Count
Percentage
Surface
29
64.4
Underground
8
17.8
Surface and Underground
7
15.6
Unknown
1
2.2