

163
available; leading to loose valuable information. To circumvent this difficulty,
the direct and cross-covariances, instead are highly advocated to be employed
for such a joint spatial continuity modeling, for which all the sample points,
including those which share only the secondary variable can also be retained.
Figure 5 shows the direct and cross-covariances obtained from gold and copper
grade at sample locations preserving the heterotopic characteristics of pattern.
Following the same instruction as stated in step 2 for direct variogram fitting
of copper grade, the semi-automatic procedure is used for fitting the direct and
cross-covariance structures, thanks to the linear coregionalization model condition, including one nugget effect and one spherical model:
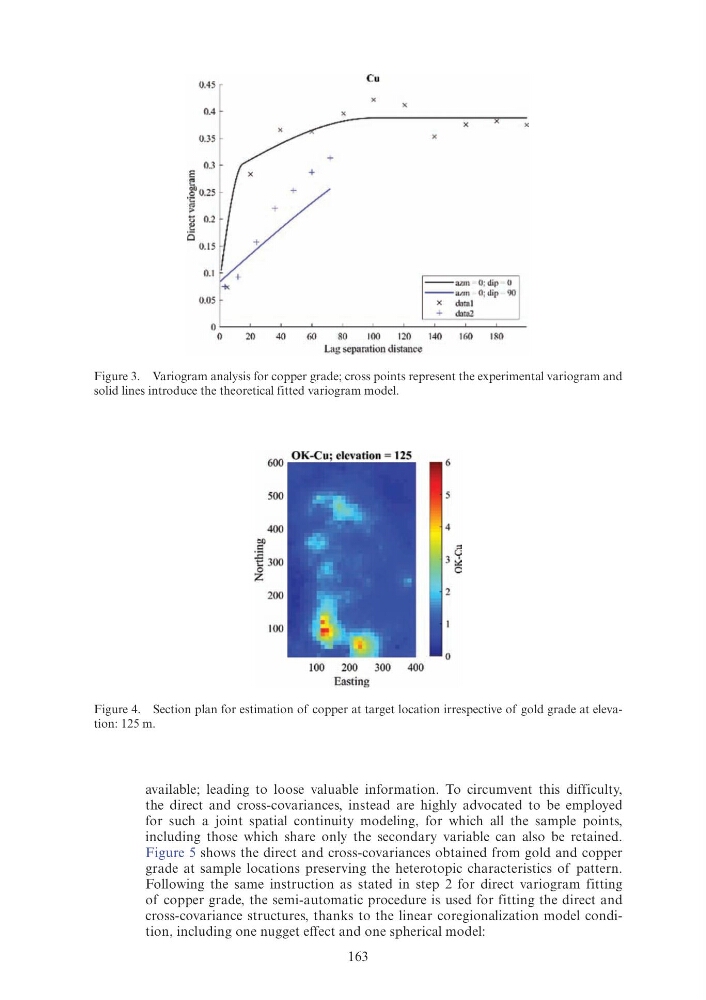
Figure 3. Variogram analysis for copper grade; cross points represent the experimental variogram and
solid lines introduce the theoretical fitted variogram model.
Figure 4. Section plan for estimation of copper at target location irrespective of gold grade at elevation: 125 m.
0.45
0.4
0.35
O • .l
~
X
~1)0.25
+
·.::
"' ;..
t
~
0.2
0
+
0. 15
0. 1
-t<.
0.05
0
0
20
40
500
400
en
;
~ 300
0
z
200
100
( ;u
X
X
+
f;Q
80
100
120
Lag sepumtion distance
100
200
Basting
300 400
X
X
- - a.zm - Cl;dip - 0
- - at.m 0; Uip 90
X
dotal
+ datal
140
160
IRO
4
8
3 ~
0
2
available; leading to loose valuable information. To circumvent this difficulty,
the direct and cross-covariances, instead are highly advocated to be employed
for such a joint spatial continuity modeling, for which all the sample points,
including those which share only the secondary variable can also be retained.
Figure 5 shows the direct and cross-covariances obtained from gold and copper
grade at sample locations preserving the heterotopic characteristics of pattern.
Following the same instruction as stated in step 2 for direct variogram fitting
of copper grade, the semi-automatic procedure is used for fitting the direct and
cross-covariance structures, thanks to the linear coregionalization model condition, including one nugget effect and one spherical model:
Figure 3. Variogram analysis for copper grade; cross points represent the experimental variogram and
solid lines introduce the theoretical fitted variogram model.
Figure 4. Section plan for estimation of copper at target location irrespective of gold grade at elevation: 125 m.
0.45
0.4
0.35
O • .l
~
X
~1)0.25
+
·.::
"' ;..
t
~
0.2
0
+
0. 15
0. 1
-t<.
0.05
0
0
20
40
500
400
en
;
~ 300
0
z
200
100
( ;u
X
X
+
f;Q
80
100
120
Lag sepumtion distance
100
200
Basting
300 400
X
X
- - a.zm - Cl;dip - 0
- - at.m 0; Uip 90
X
dotal
+ datal
140
160
IRO
4
8
3 ~
0
2