

162
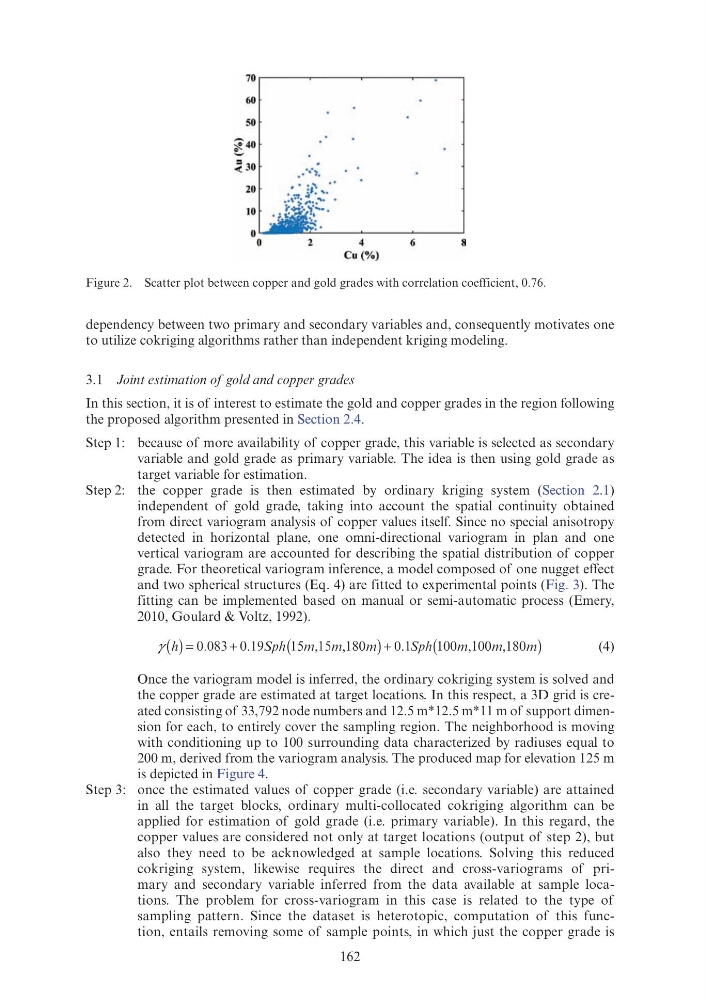
dependency between two primary and secondary variables and, consequently motivates one
to utilize cokriging algorithms rather than independent kriging modeling.
3.1 Joint estimation of gold and copper grades
In this section, it is of interest to estimate the gold and copper grades in the region following
the proposed algorithm presented in Section 2.4.
Step 1: because of more availability of copper grade, this variable is selected as secondary
variable and gold grade as primary variable. The idea is then using gold grade as
target variable for estimation.
Step 2: the copper grade is then estimated by ordinary kriging system (Section 2.1)
independent of gold grade, taking into account the spatial continuity obtained
from direct variogram analysis of copper values itself. Since no special anisotropy
detected in horizontal plane, one omni-directional variogram in plan and one
vertical variogram are accounted for describing the spatial distribution of copper
grade. For theoretical variogram inference, a model composed of one nugget effect
and two spherical structures (Eq. 4) are fitted to experimental points (Fig. 3). The
fitting can be implemented based on manual or semi-automatic process (Emery,
2010, Goulard & Voltz, 1992).
γ
Sph S
Sph S
( )
h
(
)
m
m
(
)
m
m
m
Sph S ( m
0 1
m
. Sph S ( m
(4)
Once the variogram model is inferred, the ordinary cokriging system is solved and
the copper grade are estimated at target locations. In this respect, a 3D grid is created consisting of 33,792 node numbers and 12.5 m*12.5 m*11 m of support dimension for each, to entirely cover the sampling region. The neighborhood is moving
with conditioning up to 100 surrounding data characterized by radiuses equal to
200 m, derived from the variogram analysis. The produced map for elevation 125 m
is depicted in Figure 4.
Step 3: once the estimated values of copper grade (i.e. secondary variable) are attained
in all the target blocks, ordinary multi-collocated cokriging algorithm can be
applied for estimation of gold grade (i.e. primary variable). In this regard, the
copper values are considered not only at target locations (output of step 2), but
also they need to be acknowledged at sample locations. Solving this reduced
cokriging system, likewise requires the direct and cross-variograms of primary and secondary variable inferred from the data available at sample locations. The problem for cross-variogram in this case is related to the type of
sampling pattern. Since the dataset is heterotopic, computation of this function, entails removing some of sample points, in which just the copper grade is
Figure 2. Scatter plot between copper and gold grades with correlation coefficient, 0.76.
70.-----~------~------~-.---.
60
50
~ 30
......
. · ..
4
6
8
Cu (%)
dependency between two primary and secondary variables and, consequently motivates one
to utilize cokriging algorithms rather than independent kriging modeling.
3.1 Joint estimation of gold and copper grades
In this section, it is of interest to estimate the gold and copper grades in the region following
the proposed algorithm presented in Section 2.4.
Step 1: because of more availability of copper grade, this variable is selected as secondary
variable and gold grade as primary variable. The idea is then using gold grade as
target variable for estimation.
Step 2: the copper grade is then estimated by ordinary kriging system (Section 2.1)
independent of gold grade, taking into account the spatial continuity obtained
from direct variogram analysis of copper values itself. Since no special anisotropy
detected in horizontal plane, one omni-directional variogram in plan and one
vertical variogram are accounted for describing the spatial distribution of copper
grade. For theoretical variogram inference, a model composed of one nugget effect
and two spherical structures (Eq. 4) are fitted to experimental points (Fig. 3). The
fitting can be implemented based on manual or semi-automatic process (Emery,
2010, Goulard & Voltz, 1992).
γ
Sph S
Sph S
( )
h
(
)
m
m
(
)
m
m
m
Sph S ( m
0 1
m
. Sph S ( m
(4)
Once the variogram model is inferred, the ordinary cokriging system is solved and
the copper grade are estimated at target locations. In this respect, a 3D grid is created consisting of 33,792 node numbers and 12.5 m*12.5 m*11 m of support dimension for each, to entirely cover the sampling region. The neighborhood is moving
with conditioning up to 100 surrounding data characterized by radiuses equal to
200 m, derived from the variogram analysis. The produced map for elevation 125 m
is depicted in Figure 4.
Step 3: once the estimated values of copper grade (i.e. secondary variable) are attained
in all the target blocks, ordinary multi-collocated cokriging algorithm can be
applied for estimation of gold grade (i.e. primary variable). In this regard, the
copper values are considered not only at target locations (output of step 2), but
also they need to be acknowledged at sample locations. Solving this reduced
cokriging system, likewise requires the direct and cross-variograms of primary and secondary variable inferred from the data available at sample locations. The problem for cross-variogram in this case is related to the type of
sampling pattern. Since the dataset is heterotopic, computation of this function, entails removing some of sample points, in which just the copper grade is
Figure 2. Scatter plot between copper and gold grades with correlation coefficient, 0.76.
70.-----~------~------~-.---.
60
50
~ 30
......
. · ..
4
6
8
Cu (%)