

98
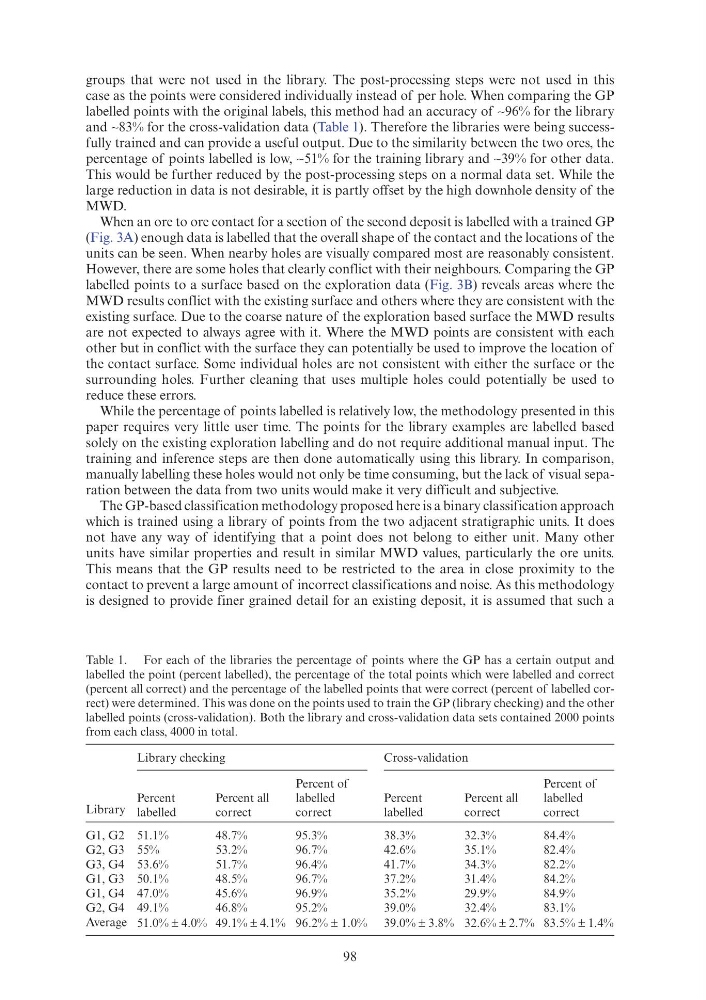
groups that were not used in the library. The post-processing steps were not used in this
case as the points were considered individually instead of per hole. When comparing the GP
labelled points with the original labels, this method had an accuracy of ∼96% for the library
and ∼83% for the cross-validation data (Table 1). Therefore the libraries were being successfully trained and can provide a useful output. Due to the similarity between the two ores, the
percentage of points labelled is low, ∼51% for the training library and ∼39% for other data.
This would be further reduced by the post-processing steps on a normal data set. While the
large reduction in data is not desirable, it is partly offset by the high downhole density of the
MWD.
When an ore to ore contact for a section of the second deposit is labelled with a trained GP
(Fig. 3A) enough data is labelled that the overall shape of the contact and the locations of the
units can be seen. When nearby holes are visually compared most are reasonably consistent.
However, there are some holes that clearly conflict with their neighbours. Comparing the GP
labelled points to a surface based on the exploration data (Fig. 3B) reveals areas where the
MWD results conflict with the existing surface and others where they are consistent with the
existing surface. Due to the coarse nature of the exploration based surface the MWD results
are not expected to always agree with it. Where the MWD points are consistent with each
other but in conflict with the surface they can potentially be used to improve the location of
the contact surface. Some individual holes are not consistent with either the surface or the
surrounding holes. Further cleaning that uses multiple holes could potentially be used to
reduce these errors.
While the percentage of points labelled is relatively low, the methodology presented in this
paper requires very little user time. The points for the library examples are labelled based
solely on the existing exploration labelling and do not require additional manual input. The
training and inference steps are then done automatically using this library. In comparison,
manually labelling these holes would not only be time consuming, but the lack of visual separation between the data from two units would make it very difficult and subjective.
The GP-based classification methodology proposed here is a binary classification approach
which is trained using a library of points from the two adjacent stratigraphic units. It does
not have any way of identifying that a point does not belong to either unit. Many other
units have similar properties and result in similar MWD values, particularly the ore units.
This means that the GP results need to be restricted to the area in close proximity to the
contact to prevent a large amount of incorrect classifications and noise. As this methodology
is designed to provide finer grained detail for an existing deposit, it is assumed that such a
Table 1. For each of the libraries the percentage of points where the GP has a certain output and
labelled the point (percent labelled), the percentage of the total points which were labelled and correct
(percent all correct) and the percentage of the labelled points that were correct (percent of labelled correct) were determined. This was done on the points used to train the GP (library checking) and the other
labelled points (cross-validation). Both the library and cross-validation data sets contained 2000 points
from each class, 4000 in total.
Library
Library checking
Cross-validation
Percent
labelled
Percent all
correct
Percent of
labelled
correct
Percent
labelled
Percent all
correct
Percent of
labelled
correct
G1, G2 51.1%
48.7%
95.3%
38.3%
32.3%
84.4%
G2, G3 55%
53.2%
96.7%
42.6%
35.1%
82.4%
G3, G4 53.6%
51.7%
96.4%
41.7%
34.3%
82.2%
G1, G3 50.1%
48.5%
96.7%
37.2%
31.4%
84.2%
G1, G4 47.0%
45.6%
96.9%
35.2%
29.9%
84.9%
G2, G4 49.1%
46.8%
95.2%
39.0%
32.4%
83.1%
Average 51.0% ± 4.0% 49.1% ± 4.1% 96.2% ± 1.0% 39.0% ± 3.8% 32.6% ± 2.7% 83.5% ± 1.4%
groups that were not used in the library. The post-processing steps were not used in this
case as the points were considered individually instead of per hole. When comparing the GP
labelled points with the original labels, this method had an accuracy of ∼96% for the library
and ∼83% for the cross-validation data (Table 1). Therefore the libraries were being successfully trained and can provide a useful output. Due to the similarity between the two ores, the
percentage of points labelled is low, ∼51% for the training library and ∼39% for other data.
This would be further reduced by the post-processing steps on a normal data set. While the
large reduction in data is not desirable, it is partly offset by the high downhole density of the
MWD.
When an ore to ore contact for a section of the second deposit is labelled with a trained GP
(Fig. 3A) enough data is labelled that the overall shape of the contact and the locations of the
units can be seen. When nearby holes are visually compared most are reasonably consistent.
However, there are some holes that clearly conflict with their neighbours. Comparing the GP
labelled points to a surface based on the exploration data (Fig. 3B) reveals areas where the
MWD results conflict with the existing surface and others where they are consistent with the
existing surface. Due to the coarse nature of the exploration based surface the MWD results
are not expected to always agree with it. Where the MWD points are consistent with each
other but in conflict with the surface they can potentially be used to improve the location of
the contact surface. Some individual holes are not consistent with either the surface or the
surrounding holes. Further cleaning that uses multiple holes could potentially be used to
reduce these errors.
While the percentage of points labelled is relatively low, the methodology presented in this
paper requires very little user time. The points for the library examples are labelled based
solely on the existing exploration labelling and do not require additional manual input. The
training and inference steps are then done automatically using this library. In comparison,
manually labelling these holes would not only be time consuming, but the lack of visual separation between the data from two units would make it very difficult and subjective.
The GP-based classification methodology proposed here is a binary classification approach
which is trained using a library of points from the two adjacent stratigraphic units. It does
not have any way of identifying that a point does not belong to either unit. Many other
units have similar properties and result in similar MWD values, particularly the ore units.
This means that the GP results need to be restricted to the area in close proximity to the
contact to prevent a large amount of incorrect classifications and noise. As this methodology
is designed to provide finer grained detail for an existing deposit, it is assumed that such a
Table 1. For each of the libraries the percentage of points where the GP has a certain output and
labelled the point (percent labelled), the percentage of the total points which were labelled and correct
(percent all correct) and the percentage of the labelled points that were correct (percent of labelled correct) were determined. This was done on the points used to train the GP (library checking) and the other
labelled points (cross-validation). Both the library and cross-validation data sets contained 2000 points
from each class, 4000 in total.
Library
Library checking
Cross-validation
Percent
labelled
Percent all
correct
Percent of
labelled
correct
Percent
labelled
Percent all
correct
Percent of
labelled
correct
G1, G2 51.1%
48.7%
95.3%
38.3%
32.3%
84.4%
G2, G3 55%
53.2%
96.7%
42.6%
35.1%
82.4%
G3, G4 53.6%
51.7%
96.4%
41.7%
34.3%
82.2%
G1, G3 50.1%
48.5%
96.7%
37.2%
31.4%
84.2%
G1, G4 47.0%
45.6%
96.9%
35.2%
29.9%
84.9%
G2, G4 49.1%
46.8%
95.2%
39.0%
32.4%
83.1%
Average 51.0% ± 4.0% 49.1% ± 4.1% 96.2% ± 1.0% 39.0% ± 3.8% 32.6% ± 2.7% 83.5% ± 1.4%