

97
remaining points that were not used in the library to conduct automated labelling. To reduce
noise and inconsistencies in the results, the two post processing steps that compare the points
within each hole were applied as described above. This post-processing produces more consistent results; however it also decreases the number of points that are labelled.
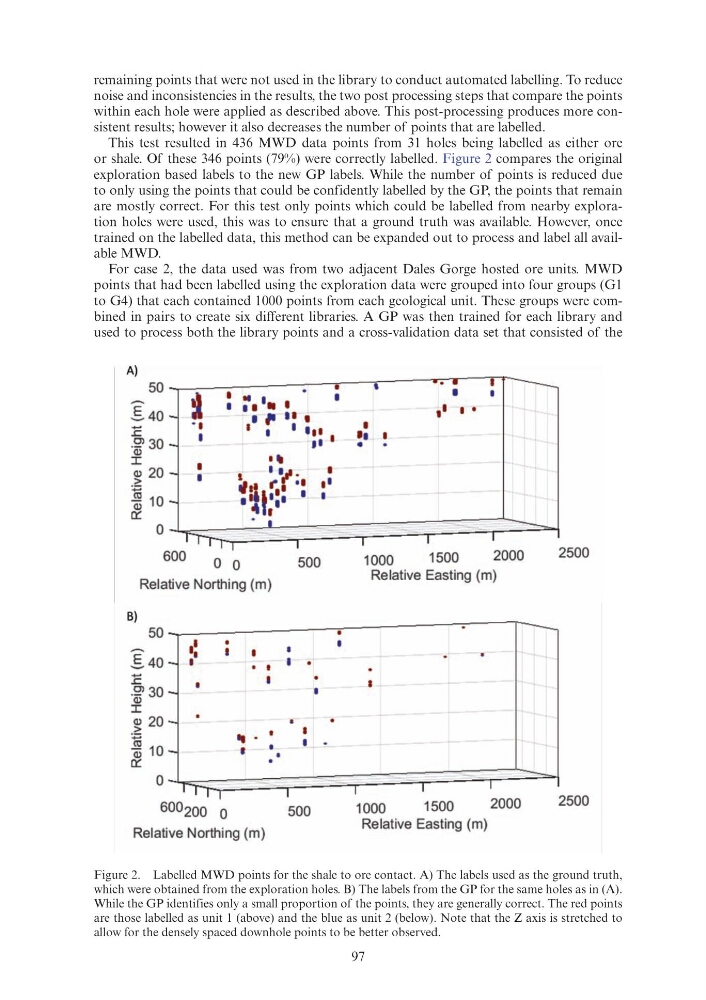
This test resulted in 436 MWD data points from 31 holes being labelled as either ore
or shale. Of these 346 points (79%) were correctly labelled. Figure 2 compares the original
exploration based labels to the new GP labels. While the number of points is reduced due
to only using the points that could be confidently labelled by the GP, the points that remain
are mostly correct. For this test only points which could be labelled from nearby exploration holes were used, this was to ensure that a ground truth was available. However, once
trained on the labelled data, this method can be expanded out to process and label all available MWD.
For case 2, the data used was from two adjacent Dales Gorge hosted ore units. MWD
points that had been labelled using the exploration data were grouped into four groups (G1
to G4) that each contained 1000 points from each geological unit. These groups were combined in pairs to create six different libraries. A GP was then trained for each library and
used to process both the library points and a cross-validation data set that consisted of the
Figure 2. Labelled MWD points for the shale to ore contact. A) The labels used as the ground truth,
which were obtained from the exploration holes. B) The labels from the GP for the same holes as in (A).
While the GP identifies only a small proportion of the points, they are generally correct. The red points
are those labelled as unit 1 (above) and the blue as unit 2 (below). Note that the Z axis is stretched to
allow for the densely spaced downhole points to be better observed.
A)
50~-----------------= .----. ------~~--~~
j : ~. ~ . . .
I
--S40
E
.2130 (l)
I
(l) 20
-~
~ 10
a::::
" I
I I' II I
I
I
I
I I ll
•
•
Jl I
.,
l
I....
I
., •• t' . •• I I
,lltl:a I I
~ .
600
0 0
Relative Northing (m)
500
B)
-
.c
.2130 (l)
I
(l) 20
-~
~ 10
a::::
0
600 200 0
500
Relative Northing (m)
II I o
•
I I I
•
1000
1500
2000
Relative Easting (m)
1000
1500
2000
Relative Easting (m)
2500
2500
remaining points that were not used in the library to conduct automated labelling. To reduce
noise and inconsistencies in the results, the two post processing steps that compare the points
within each hole were applied as described above. This post-processing produces more consistent results; however it also decreases the number of points that are labelled.
This test resulted in 436 MWD data points from 31 holes being labelled as either ore
or shale. Of these 346 points (79%) were correctly labelled. Figure 2 compares the original
exploration based labels to the new GP labels. While the number of points is reduced due
to only using the points that could be confidently labelled by the GP, the points that remain
are mostly correct. For this test only points which could be labelled from nearby exploration holes were used, this was to ensure that a ground truth was available. However, once
trained on the labelled data, this method can be expanded out to process and label all available MWD.
For case 2, the data used was from two adjacent Dales Gorge hosted ore units. MWD
points that had been labelled using the exploration data were grouped into four groups (G1
to G4) that each contained 1000 points from each geological unit. These groups were combined in pairs to create six different libraries. A GP was then trained for each library and
used to process both the library points and a cross-validation data set that consisted of the
Figure 2. Labelled MWD points for the shale to ore contact. A) The labels used as the ground truth,
which were obtained from the exploration holes. B) The labels from the GP for the same holes as in (A).
While the GP identifies only a small proportion of the points, they are generally correct. The red points
are those labelled as unit 1 (above) and the blue as unit 2 (below). Note that the Z axis is stretched to
allow for the densely spaced downhole points to be better observed.
A)
50~-----------------= .----. ------~~--~~
j : ~. ~ . . .
I
--S40
E
.2130 (l)
I
(l) 20
-~
~ 10
a::::
" I
I I' II I
I
I
I
I I ll
•
•
Jl I
.,
l
I....
I
., •• t' . •• I I
,lltl:a I I
~ .
600
0 0
Relative Northing (m)
500
B)
-
.c
.2130 (l)
I
(l) 20
-~
~ 10
a::::
0
600 200 0
500
Relative Northing (m)
II I o
•
I I I
•
1000
1500
2000
Relative Easting (m)
1000
1500
2000
Relative Easting (m)
2500
2500