

96
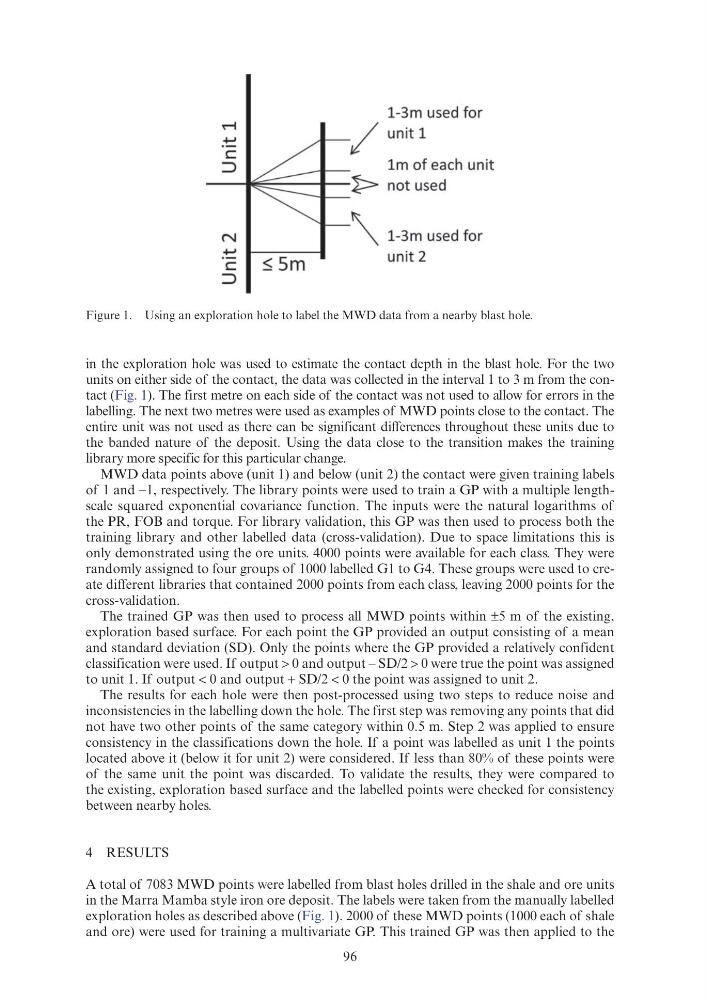
in the exploration hole was used to estimate the contact depth in the blast hole. For the two
units on either side of the contact, the data was collected in the interval 1 to 3 m from the contact (Fig. 1). The first metre on each side of the contact was not used to allow for errors in the
labelling. The next two metres were used as examples of MWD points close to the contact. The
entire unit was not used as there can be significant differences throughout these units due to
the banded nature of the deposit. Using the data close to the transition makes the training
library more specific for this particular change.
MWD data points above (unit 1) and below (unit 2) the contact were given training labels
of 1 and −1, respectively. The library points were used to train a GP with a multiple lengthscale squared exponential covariance function. The inputs were the natural logarithms of
the PR, FOB and torque. For library validation, this GP was then used to process both the
training library and other labelled data (cross-validation). Due to space limitations this is
only demonstrated using the ore units. 4000 points were available for each class. They were
randomly assigned to four groups of 1000 labelled G1 to G4. These groups were used to create different libraries that contained 2000 points from each class, leaving 2000 points for the
cross-validation.
The trained GP was then used to process all MWD points within ±5 m of the existing,
exploration based surface. For each point the GP provided an output consisting of a mean
and standard deviation (SD). Only the points where the GP provided a relatively confident
classification were used. If output > 0 and output – SD/2 > 0 were true the point was assigned
to unit 1. If output < 0 and output + SD/2 < 0 the point was assigned to unit 2.
The results for each hole were then post-processed using two steps to reduce noise and
inconsistencies in the labelling down the hole. The first step was removing any points that did
not have two other points of the same category within 0.5 m. Step 2 was applied to ensure
consistency in the classifications down the hole. If a point was labelled as unit 1 the points
located above it (below it for unit 2) were considered. If less than 80% of these points were
of the same unit the point was discarded. To validate the results, they were compared to
the existing, exploration based surface and the labelled points were checked for consistency
between nearby holes.
4 RESULTS
A total of 7083 MWD points were labelled from blast holes drilled in the shale and ore units
in the Marra Mamba style iron ore deposit. The labels were taken from the manually labelled
exploration holes as described above (Fig. 1). 2000 of these MWD points (1000 each of shale
and ore) were used for training a multivariate GP. This trained GP was then applied to the
Figure 1. Using an exploration hole to label the MWD data from a nearby blast hole.
1-3m used for
~
/
unit 1
.t:
c
:::>
1m of each unit
>
not used
N
~ 1-3m used for
~
unit 2
c
~Sm
:::>
in the exploration hole was used to estimate the contact depth in the blast hole. For the two
units on either side of the contact, the data was collected in the interval 1 to 3 m from the contact (Fig. 1). The first metre on each side of the contact was not used to allow for errors in the
labelling. The next two metres were used as examples of MWD points close to the contact. The
entire unit was not used as there can be significant differences throughout these units due to
the banded nature of the deposit. Using the data close to the transition makes the training
library more specific for this particular change.
MWD data points above (unit 1) and below (unit 2) the contact were given training labels
of 1 and −1, respectively. The library points were used to train a GP with a multiple lengthscale squared exponential covariance function. The inputs were the natural logarithms of
the PR, FOB and torque. For library validation, this GP was then used to process both the
training library and other labelled data (cross-validation). Due to space limitations this is
only demonstrated using the ore units. 4000 points were available for each class. They were
randomly assigned to four groups of 1000 labelled G1 to G4. These groups were used to create different libraries that contained 2000 points from each class, leaving 2000 points for the
cross-validation.
The trained GP was then used to process all MWD points within ±5 m of the existing,
exploration based surface. For each point the GP provided an output consisting of a mean
and standard deviation (SD). Only the points where the GP provided a relatively confident
classification were used. If output > 0 and output – SD/2 > 0 were true the point was assigned
to unit 1. If output < 0 and output + SD/2 < 0 the point was assigned to unit 2.
The results for each hole were then post-processed using two steps to reduce noise and
inconsistencies in the labelling down the hole. The first step was removing any points that did
not have two other points of the same category within 0.5 m. Step 2 was applied to ensure
consistency in the classifications down the hole. If a point was labelled as unit 1 the points
located above it (below it for unit 2) were considered. If less than 80% of these points were
of the same unit the point was discarded. To validate the results, they were compared to
the existing, exploration based surface and the labelled points were checked for consistency
between nearby holes.
4 RESULTS
A total of 7083 MWD points were labelled from blast holes drilled in the shale and ore units
in the Marra Mamba style iron ore deposit. The labels were taken from the manually labelled
exploration holes as described above (Fig. 1). 2000 of these MWD points (1000 each of shale
and ore) were used for training a multivariate GP. This trained GP was then applied to the
Figure 1. Using an exploration hole to label the MWD data from a nearby blast hole.
1-3m used for
~
/
unit 1
.t:
c
:::>
1m of each unit
>
not used
N
~ 1-3m used for
~
unit 2
c
~Sm
:::>