

a chemical bond. Empirically, there exists a good quantitative relationship between
R, BO, and BE: the longer R, the less BE or the lower BO a bond has, the easier the
bond breaks [12]. Thus, R or BO might be directly used to identify the trigger bond,
without relying upon BE.
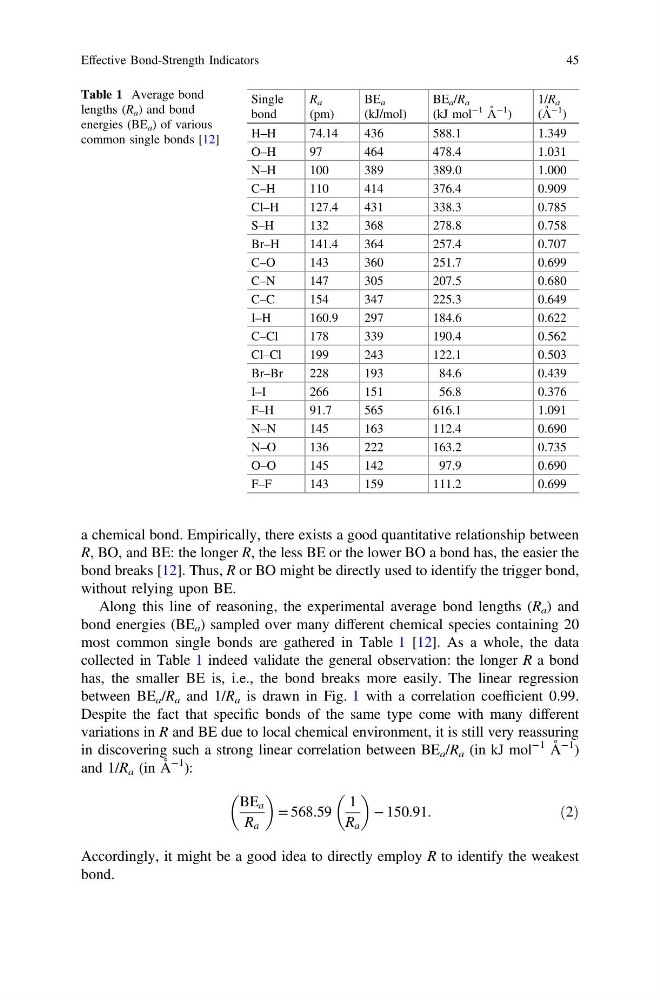
Along this line of reasoning, the experimental average bond lengths (R a ) and
bond energies (BE a ) sampled over many different chemical species containing 20
most common single bonds are gathered in Table 1 [12]. As a whole, the data
collected in Table 1 indeed validate the general observation: the longer R a bond
has, the smaller BE is, i.e., the bond breaks more easily. The linear regression
between BE a /R a and 1/R a is drawn in Fig. 1 with a correlation coefficient 0.99.
Despite the fact that specific bonds of the same type come with many different
variations in R and BE due to local chemical environment, it is still very reassuring
in discovering such a strong linear correlation between BE a /R a (in kJ mol
−1 Å
−1 )
and 1/R a (in Å
−1 ):
BE a
R a
= 568.59
1
R a
− 150.91.
ð2Þ
Accordingly, it might be a good idea to directly employ R to identify the weakest
bond.
Table 1 Average bond
lengths (R a ) and bond
energies (BE a ) of various
common single bonds [12]
Single
bond
R a
(pm)
BE a
(kJ/mol)
BE a /R a
(kJ mol
−1 Å
−1
)
1/R a
(Å
−1
)
H–H
74.14
436
588.1
1.349
O–H
97
464
478.4
1.031
N–H
100
389
389.0
1.000
C–H
110
414
376.4
0.909
Cl–H
127.4
431
338.3
0.785
S–H
132
368
278.8
0.758
Br–H
141.4
364
257.4
0.707
C–O
143
360
251.7
0.699
C–N
147
305
207.5
0.680
C–C
154
347
225.3
0.649
I–H
160.9
297
184.6
0.622
C–Cl
178
339
190.4
0.562
Cl–Cl
199
243
122.1
0.503
Br–Br
228
193
84.6
0.439
I–I
266
151
56.8
0.376
F–H
91.7
565
616.1
1.091
N–N
145
163
112.4
0.690
N–O
136
222
163.2
0.735
O–O
145
142
97.9
0.690
F–F
143
159
111.2
0.699
Effective Bond-Strength Indicators
45
R, BO, and BE: the longer R, the less BE or the lower BO a bond has, the easier the
bond breaks [12]. Thus, R or BO might be directly used to identify the trigger bond,
without relying upon BE.
Along this line of reasoning, the experimental average bond lengths (R a ) and
bond energies (BE a ) sampled over many different chemical species containing 20
most common single bonds are gathered in Table 1 [12]. As a whole, the data
collected in Table 1 indeed validate the general observation: the longer R a bond
has, the smaller BE is, i.e., the bond breaks more easily. The linear regression
between BE a /R a and 1/R a is drawn in Fig. 1 with a correlation coefficient 0.99.
Despite the fact that specific bonds of the same type come with many different
variations in R and BE due to local chemical environment, it is still very reassuring
in discovering such a strong linear correlation between BE a /R a (in kJ mol
−1 Å
−1 )
and 1/R a (in Å
−1 ):
BE a
R a
= 568.59
1
R a
− 150.91.
ð2Þ
Accordingly, it might be a good idea to directly employ R to identify the weakest
bond.
Table 1 Average bond
lengths (R a ) and bond
energies (BE a ) of various
common single bonds [12]
Single
bond
R a
(pm)
BE a
(kJ/mol)
BE a /R a
(kJ mol
−1 Å
−1
)
1/R a
(Å
−1
)
H–H
74.14
436
588.1
1.349
O–H
97
464
478.4
1.031
N–H
100
389
389.0
1.000
C–H
110
414
376.4
0.909
Cl–H
127.4
431
338.3
0.785
S–H
132
368
278.8
0.758
Br–H
141.4
364
257.4
0.707
C–O
143
360
251.7
0.699
C–N
147
305
207.5
0.680
C–C
154
347
225.3
0.649
I–H
160.9
297
184.6
0.622
C–Cl
178
339
190.4
0.562
Cl–Cl
199
243
122.1
0.503
Br–Br
228
193
84.6
0.439
I–I
266
151
56.8
0.376
F–H
91.7
565
616.1
1.091
N–N
145
163
112.4
0.690
N–O
136
222
163.2
0.735
O–O
145
142
97.9
0.690
F–F
143
159
111.2
0.699
Effective Bond-Strength Indicators
45