

On the other hand, many previous studies [4–7] have primarily used the
Mulliken interatomic electron number (MIEN), calculated via the Mulliken
population analysis [13], to identify the trigger bond. Normally, only the bond with
the smallest MIEN from the same type of bonds is selected for further consideration
[4–7]. However, the bond with the smallest MIEN might not necessarily have the
lowest BDE among the bonds within a molecule. Taking 2,4,6-trinitrotoluene
(TNT) for example, the MIENs of all C–NO 2 bonds are among the smallest (see
Table 2), indicating one of the C–NO 2 bonds to be the trigger bond. However, to
single out which C–NO 2 bond to break first, calculations of the BDEs of these
specific C–NO 2 bonds have been carried out. In Table 2, the C 3 –N 11 bond has the
smallest MIEN (0.1468), whereas the C 1 –N 14 or C 5 –N 8 bond has the lowest BDE,
237.75 kJ/mol. Clearly, the smallest MIEN may not correspond to the lowest BDE.
Alternatively, within the quantum theory of atoms in molecules [14, 15], Bader
proposed several parameters to indicate the relative bond strength using the idea
associated with bond critical points (BCPs). These BCPs are located at the interatomic surface between a pair of atoms, at which the electron density reaches
minimum in one dimension, yet reaches maximum in the other two dimensions. As
Bader originally suggested, the value of the electron density at such a bond critical
point between a pair of atoms of a chemical bond, ρ c , can be used to measure the
strength of the chemical bond. On the other hand, the BE is an integral of the
electron density over the associated interatomic surface between an atomic pair.
Unfortunately, this BE integral has an unknown system-dependent dimensionless
proportionality pre-factor. As a result, Bader’s ρ c indicator can only be used to
compare the same kind of bonds between the same pair of atoms within very similar
local chemical environment and might not be able to evaluate the strengths of
different kinds of bonds even within the same molecule.
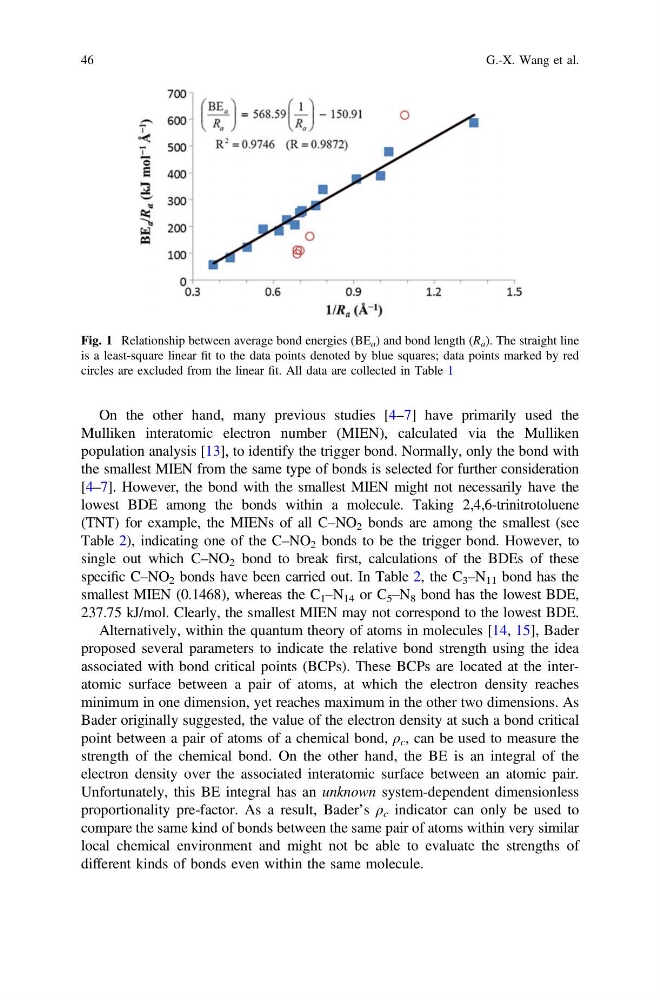
Fig. 1 Relationship between average bond energies (BE a ) and bond length (R a ). The straight line
is a least-square linear fit to the data points denoted by blue squares; data points marked by red
circles are excluded from the linear fit. All data are collected in Table 1
46
G.-X. Wang et al.
Mulliken interatomic electron number (MIEN), calculated via the Mulliken
population analysis [13], to identify the trigger bond. Normally, only the bond with
the smallest MIEN from the same type of bonds is selected for further consideration
[4–7]. However, the bond with the smallest MIEN might not necessarily have the
lowest BDE among the bonds within a molecule. Taking 2,4,6-trinitrotoluene
(TNT) for example, the MIENs of all C–NO 2 bonds are among the smallest (see
Table 2), indicating one of the C–NO 2 bonds to be the trigger bond. However, to
single out which C–NO 2 bond to break first, calculations of the BDEs of these
specific C–NO 2 bonds have been carried out. In Table 2, the C 3 –N 11 bond has the
smallest MIEN (0.1468), whereas the C 1 –N 14 or C 5 –N 8 bond has the lowest BDE,
237.75 kJ/mol. Clearly, the smallest MIEN may not correspond to the lowest BDE.
Alternatively, within the quantum theory of atoms in molecules [14, 15], Bader
proposed several parameters to indicate the relative bond strength using the idea
associated with bond critical points (BCPs). These BCPs are located at the interatomic surface between a pair of atoms, at which the electron density reaches
minimum in one dimension, yet reaches maximum in the other two dimensions. As
Bader originally suggested, the value of the electron density at such a bond critical
point between a pair of atoms of a chemical bond, ρ c , can be used to measure the
strength of the chemical bond. On the other hand, the BE is an integral of the
electron density over the associated interatomic surface between an atomic pair.
Unfortunately, this BE integral has an unknown system-dependent dimensionless
proportionality pre-factor. As a result, Bader’s ρ c indicator can only be used to
compare the same kind of bonds between the same pair of atoms within very similar
local chemical environment and might not be able to evaluate the strengths of
different kinds of bonds even within the same molecule.
Fig. 1 Relationship between average bond energies (BE a ) and bond length (R a ). The straight line
is a least-square linear fit to the data points denoted by blue squares; data points marked by red
circles are excluded from the linear fit. All data are collected in Table 1
46
G.-X. Wang et al.