

196
Strain-Engineered MOSFETs
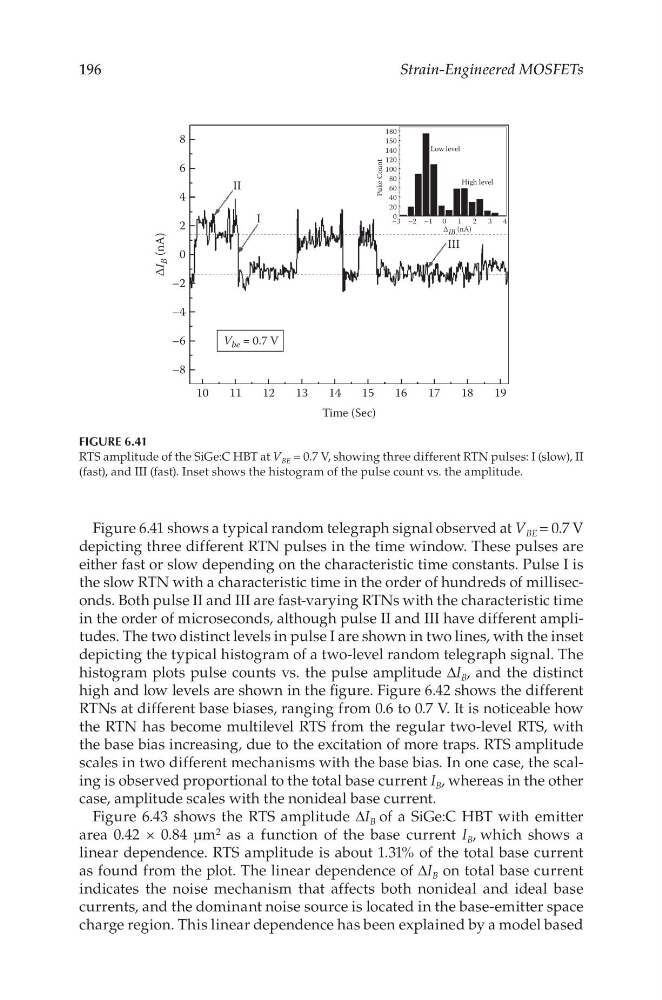
Figure 6.41 shows a typical random telegraph signal observed at V BE = 0.7 V
depicting three different RTN pulses in the time window. These pulses are
either fast or slow depending on the characteristic time constants. Pulse I is
the slow RTN with a characteristic time in the order of hundreds of milliseconds. Both pulse II and III are fast-varying RTNs with the characteristic time
in the order of microseconds, although pulse II and III have different amplitudes. The two distinct levels in pulse I are shown in two lines, with the inset
depicting the typical histogram of a two-level random telegraph signal. The
histogram plots pulse counts vs. the pulse amplitude ΔI B , and the distinct
high and low levels are shown in the figure. Figure 6.42 shows the different
RTNs at different base biases, ranging from 0.6 to 0.7 V. It is noticeable how
the RTN has become multilevel RTS from the regular two-level RTS, with
the base bias increasing, due to the excitation of more traps. RTS amplitude
scales in two different mechanisms with the base bias. In one case, the scaling is observed proportional to the total base current I B , whereas in the other
case, amplitude scales with the nonideal base current.
Figure 6.43 shows the RTS amplitude ΔI B of a SiGe:C HBT with emitter
area 0.42 × 0.84 µm 2 as a function of the base current I B , which shows a
linear dependence. RTS amplitude is about 1.31% of the total base current
as found from the plot. The linear dependence of ΔI B on total base current
indicates the noise mechanism that affects both nonideal and ideal base
currents, and the dominant noise source is located in the base-emitter space
charge region. This linear dependence has been explained by a model based
10
–8
–6
–4
–2
0
∆I
B (nA)
2
0
–3 –2 –1
Low level
High level
0
∆ IB (nA)
1
2
3
4
20
40
60
80
100
Puke Count
120
140
150
180
4
II
III
I
6
8
11
12
13
14
15
Time (Sec)
V be = 0.7 V
16
17
18
19
FIGURE 6.41
RTS amplitude of the SiGe:C HBT at V BE = 0.7 V, showing three different RTN pulses: I (slow), II
(fast), and III (fast). Inset shows the histogram of the pulse count vs. the amplitude.
Strain-Engineered MOSFETs
Figure 6.41 shows a typical random telegraph signal observed at V BE = 0.7 V
depicting three different RTN pulses in the time window. These pulses are
either fast or slow depending on the characteristic time constants. Pulse I is
the slow RTN with a characteristic time in the order of hundreds of milliseconds. Both pulse II and III are fast-varying RTNs with the characteristic time
in the order of microseconds, although pulse II and III have different amplitudes. The two distinct levels in pulse I are shown in two lines, with the inset
depicting the typical histogram of a two-level random telegraph signal. The
histogram plots pulse counts vs. the pulse amplitude ΔI B , and the distinct
high and low levels are shown in the figure. Figure 6.42 shows the different
RTNs at different base biases, ranging from 0.6 to 0.7 V. It is noticeable how
the RTN has become multilevel RTS from the regular two-level RTS, with
the base bias increasing, due to the excitation of more traps. RTS amplitude
scales in two different mechanisms with the base bias. In one case, the scaling is observed proportional to the total base current I B , whereas in the other
case, amplitude scales with the nonideal base current.
Figure 6.43 shows the RTS amplitude ΔI B of a SiGe:C HBT with emitter
area 0.42 × 0.84 µm 2 as a function of the base current I B , which shows a
linear dependence. RTS amplitude is about 1.31% of the total base current
as found from the plot. The linear dependence of ΔI B on total base current
indicates the noise mechanism that affects both nonideal and ideal base
currents, and the dominant noise source is located in the base-emitter space
charge region. This linear dependence has been explained by a model based
10
–8
–6
–4
–2
0
∆I
B (nA)
2
0
–3 –2 –1
Low level
High level
0
∆ IB (nA)
1
2
3
4
20
40
60
80
100
Puke Count
120
140
150
180
4
II
III
I
6
8
11
12
13
14
15
Time (Sec)
V be = 0.7 V
16
17
18
19
FIGURE 6.41
RTS amplitude of the SiGe:C HBT at V BE = 0.7 V, showing three different RTN pulses: I (slow), II
(fast), and III (fast). Inset shows the histogram of the pulse count vs. the amplitude.