

194
Strain-Engineered MOSFETs
current noise spectral density can be expressed in the following form [8],
where N is the number of independent traps:
S f
I
f
( )
4( )
(
)((1/
1/ ) (2 ) )
I
i
li
hi
li
hi
i
N
2
2
2
∑
=
τ + τ
τ + τ
+ π
(6.63)
where ΔI i is the amplitude of the ith trap, and τ li and τ hi are the mean times
in low and high current levels, respectively. Equation (6.63) has been used
to calculate theoretical noise spectral densities for three different values of
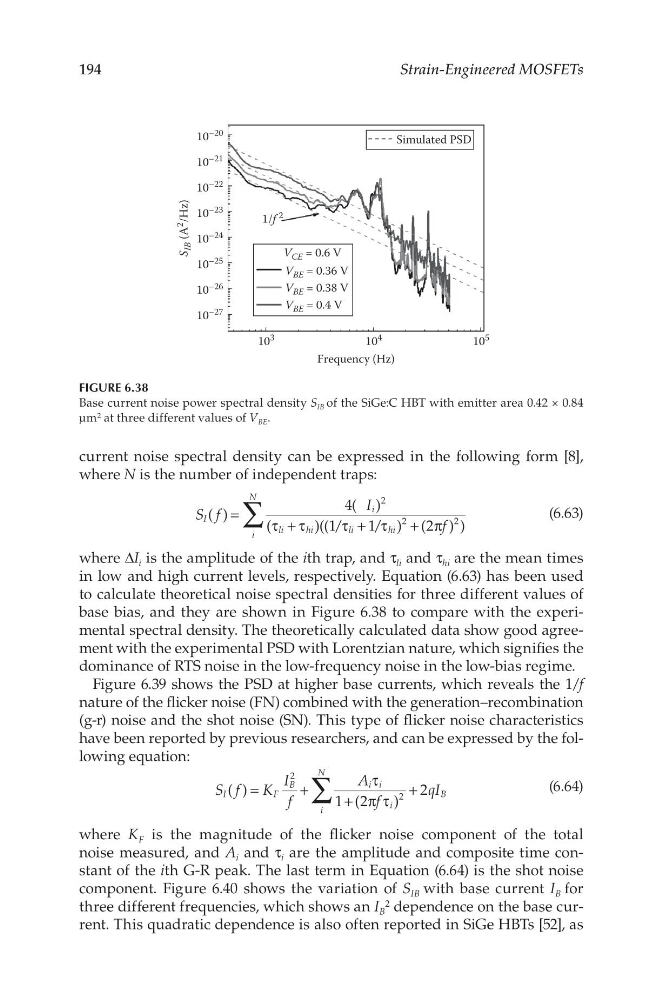
base bias, and they are shown in Figure 6.38 to compare with the experimental spectral density. The theoretically calculated data show good agreement with the experimental PSD with Lorentzian nature, which signifies the
dominance of RTS noise in the low-frequency noise in the low-bias regime.
Figure 6.39 shows the PSD at higher base currents, which reveals the 1/f
nature of the flicker noise (FN) combined with the generation–recombination
(g-r) noise and the shot noise (SN). This type of flicker noise characteristics
have been reported by previous researchers, and can be expressed by the following equation:
S f
K
I
f
A
f
qI
( )
1 (2
)
2
I
F
B
i i
i
i
N
B
2
2
∑
=
+
τ
+ π τ
+
(6.64)
where K F is the magnitude of the flicker noise component of the total
noise measured, and A i and τ i are the amplitude and composite time constant of the ith G-R peak. The last term in Equation (6.64) is the shot noise
component. Figure 6.40 shows the variation of S IB with base current I B for
three different frequencies, which shows an I B
2 dependence on the base current. This quadratic dependence is also often reported in SiGe HBTs [52], as
10
–20
10
3
10
4
10
5
10
–26
10
–25
10
–24
S
IB (A
2
/Hz)
V CE = 0.6 V
Simulated PSD
1/f 2
V BE = 0.36 V
V BE = 0.38 V
V BE = 0.4 V
10 –23
10
–22
10
–21
10
–27
Frequency (Hz)
FIGURE 6.38
Base current noise power spectral density S IB of the SiGe:C HBT with emitter area 0.42 × 0.84
µm 2 at three different values of V BE .
Strain-Engineered MOSFETs
current noise spectral density can be expressed in the following form [8],
where N is the number of independent traps:
S f
I
f
( )
4( )
(
)((1/
1/ ) (2 ) )
I
i
li
hi
li
hi
i
N
2
2
2
∑
=
τ + τ
τ + τ
+ π
(6.63)
where ΔI i is the amplitude of the ith trap, and τ li and τ hi are the mean times
in low and high current levels, respectively. Equation (6.63) has been used
to calculate theoretical noise spectral densities for three different values of
base bias, and they are shown in Figure 6.38 to compare with the experimental spectral density. The theoretically calculated data show good agreement with the experimental PSD with Lorentzian nature, which signifies the
dominance of RTS noise in the low-frequency noise in the low-bias regime.
Figure 6.39 shows the PSD at higher base currents, which reveals the 1/f
nature of the flicker noise (FN) combined with the generation–recombination
(g-r) noise and the shot noise (SN). This type of flicker noise characteristics
have been reported by previous researchers, and can be expressed by the following equation:
S f
K
I
f
A
f
qI
( )
1 (2
)
2
I
F
B
i i
i
i
N
B
2
2
∑
=
+
τ
+ π τ
+
(6.64)
where K F is the magnitude of the flicker noise component of the total
noise measured, and A i and τ i are the amplitude and composite time constant of the ith G-R peak. The last term in Equation (6.64) is the shot noise
component. Figure 6.40 shows the variation of S IB with base current I B for
three different frequencies, which shows an I B
2 dependence on the base current. This quadratic dependence is also often reported in SiGe HBTs [52], as
10
–20
10
3
10
4
10
5
10
–26
10
–25
10
–24
S
IB (A
2
/Hz)
V CE = 0.6 V
Simulated PSD
1/f 2
V BE = 0.36 V
V BE = 0.38 V
V BE = 0.4 V
10 –23
10
–22
10
–21
10
–27
Frequency (Hz)
FIGURE 6.38
Base current noise power spectral density S IB of the SiGe:C HBT with emitter area 0.42 × 0.84
µm 2 at three different values of V BE .