

Theor Chem Acc (2015) 134:117
1 3
the process of bonding places electrons into the bonding
region decreasing the volume of the AIM. As well, we can
easily distinguish between bridging and terminal hydrogen
in B 2 H 6 from volume differences. The bridging hydrogen
each share electron density among two bonds making its
AIM volume signifi cantly smaller than the singly bonded
terminal hydrogen.
The average shape and volume of several AIM also
reveal electron density distortion for molecular atoms.
Figure 6 shows that Li AIM shrinks in size relative to the Li
atom, consistent with lithium’s low electronegativity and its
propensity to lose electron density upon bonding. Moreover, there is little overlap observed between the Li AIM and
its bonded atom, indicative of the cationic character of Li.
In contrast, there is much more overlap in the covalently
bonded atoms. The overlap, which increases in the order
F 2 ≈ C 2 < O 2 < N 2 correlates with the increase in bond
order.
Another property that can be calculated is the dipole,
which is a measure of charge polarization of the atom in a
molecule. The dipole of several Li AIM in LiX molecules
is given in Table 3 . These dipole values correlate well with
electronegativity differences: the greater the electronegativity difference between Li and X, the larger the dipole of the
Li AIM.
The benefi t of AIM go beyond determining atomic
properties. We seek to create an AIM database where the
electron density and properties of larger molecules can be
built and approximated from the appropriate combination
of AIM. Since molecular atoms in ABIM are represented as
overlapping AIM, then the electron density can be built to a
fi rst approximation as a linear combination of AIM.
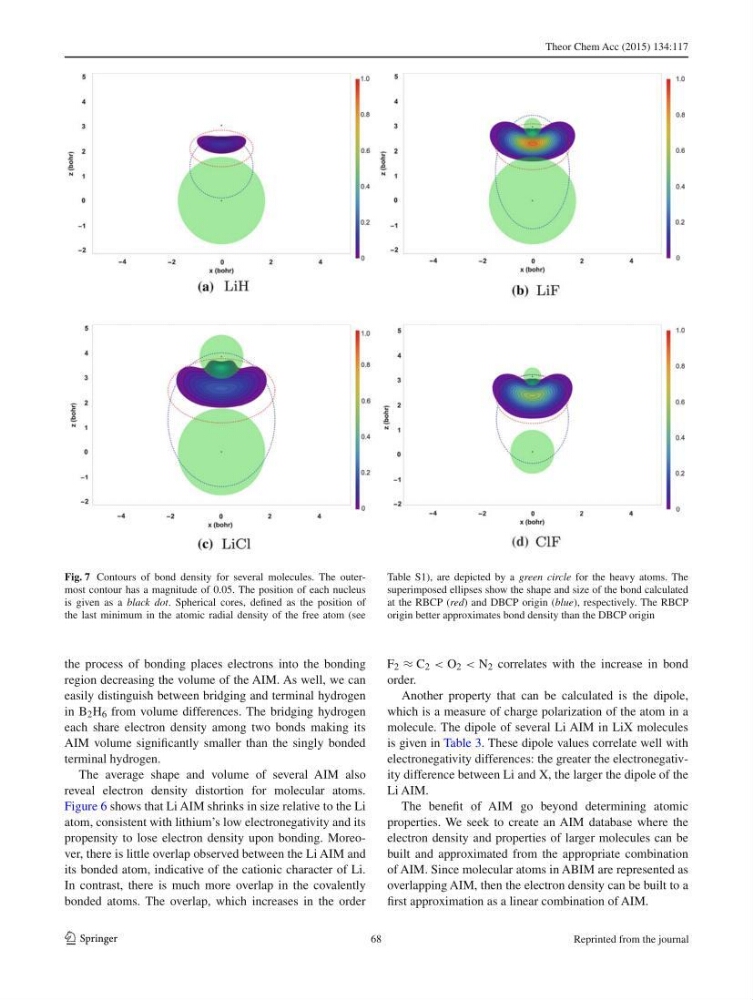
Fig. 7 Contours of bond density for several molecules. The outermost contour has a magnitude of 0.05. The position of each nucleus
is given as a black dot . Spherical cores, defi ned as the position of
the last minimum in the atomic radial density of the free atom (see
Table S1), are depicted by a green circle for the heavy atoms. The
superimposed ellipses show the shape and size of the bond calculated
at the RBCP ( red ) and DBCP origin ( blue ), respectively. The RBCP
origin better approximates bond density than the DBCP origin
68
Reprinted from the journal
1 3
the process of bonding places electrons into the bonding
region decreasing the volume of the AIM. As well, we can
easily distinguish between bridging and terminal hydrogen
in B 2 H 6 from volume differences. The bridging hydrogen
each share electron density among two bonds making its
AIM volume signifi cantly smaller than the singly bonded
terminal hydrogen.
The average shape and volume of several AIM also
reveal electron density distortion for molecular atoms.
Figure 6 shows that Li AIM shrinks in size relative to the Li
atom, consistent with lithium’s low electronegativity and its
propensity to lose electron density upon bonding. Moreover, there is little overlap observed between the Li AIM and
its bonded atom, indicative of the cationic character of Li.
In contrast, there is much more overlap in the covalently
bonded atoms. The overlap, which increases in the order
F 2 ≈ C 2 < O 2 < N 2 correlates with the increase in bond
order.
Another property that can be calculated is the dipole,
which is a measure of charge polarization of the atom in a
molecule. The dipole of several Li AIM in LiX molecules
is given in Table 3 . These dipole values correlate well with
electronegativity differences: the greater the electronegativity difference between Li and X, the larger the dipole of the
Li AIM.
The benefi t of AIM go beyond determining atomic
properties. We seek to create an AIM database where the
electron density and properties of larger molecules can be
built and approximated from the appropriate combination
of AIM. Since molecular atoms in ABIM are represented as
overlapping AIM, then the electron density can be built to a
fi rst approximation as a linear combination of AIM.
Fig. 7 Contours of bond density for several molecules. The outermost contour has a magnitude of 0.05. The position of each nucleus
is given as a black dot . Spherical cores, defi ned as the position of
the last minimum in the atomic radial density of the free atom (see
Table S1), are depicted by a green circle for the heavy atoms. The
superimposed ellipses show the shape and size of the bond calculated
at the RBCP ( red ) and DBCP origin ( blue ), respectively. The RBCP
origin better approximates bond density than the DBCP origin
68
Reprinted from the journal