

Theor Chem Acc (2015) 134:117
1 3
electrons along this ring, due to the electrons residing close
to the bond point or the nonbonding regions.
Critical features can be more easily identifi ed using contour plots of the gradient length of radial density, |∇ρ rad | ,
as shown in Figure S17–S22 of the supporting information.
3.3 Atoms in molecules
AIM properties can be quickly and easily calculated,
including shape, volume [ 19 ], r , r 2 (Table 2 ), and dipole
(Table 3 ). For comparison, these properties are also given
for free atoms and ions in Table S2.
Several intuitive trends can be extracted from these
calculated properties. First of all, as given in Table 2 ,
volume is generally proportional to r 2 . This is consistent with results found by Blair and Thakkar, who
determined that the best correlation between volume
and r 2 for a set of 1641 organic molecules could be
approximated by V ≈ 29.073r 2
1/2
[ 20 ]. Another
observation is that the volume of an AIM in comparison with the free atom and ions follows the same trend
as its ionic state. For example, hydrogen AIM ordered
by volume result in: H
−
2 > H − > LiH > H atom
> H 2 > CH 4 > H 2 O > H
+
2 . As expected, this trend
shows anionic hydrogen tend to be larger than covalently
bonded hydrogen which are subsequently larger than cationic hydrogen. For other heavy atoms, the AIM is generally smaller in volume than the free neutral atom because
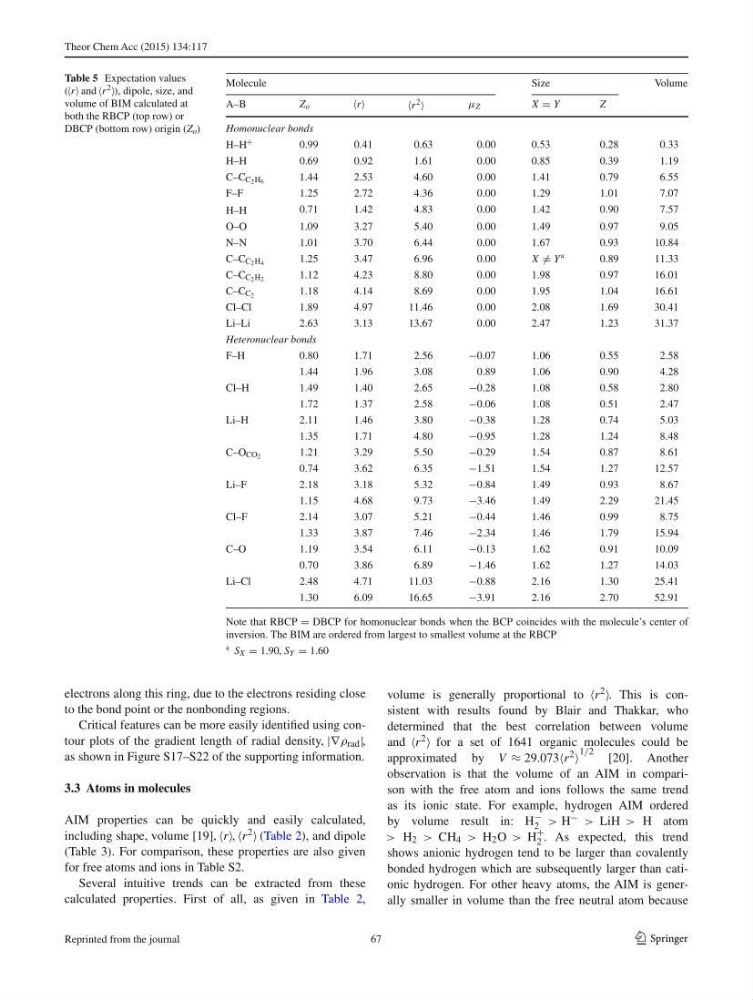
Table 5 Expectation values
( r and r 2 ), dipole, size, and
volume of BIM calculated at
both the RBCP (top row) or
DBCP (bottom row) origin ( Z o )
Note that RBCP = DBCP for homonuclear bonds when the BCP coincides with the molecule’s center of
inversion. The BIM are ordered from largest to smallest volume at the RBCP
a S X = 1.90 , S Y = 1.60
Molecule
Size
Volume
A–B
Z o
r
r 2
μ Z
X = Y
Z
Homonuclear bonds
H–H +
0.99
0.41
0.63
0.00
0.53
0.28
0.33
H–H
0.69
0.92
1.61
0.00
0.85
0.39
1.19
C–C C 2 H 6
1.44
2.53
4.60
0.00
1.41
0.79
6.55
F–F
1.25
2.72
4.36
0.00
1.29
1.01
7.07
H–H
0.71
1.42
4.83
0.00
1.42
0.90
7.57
O–O
1.09
3.27
5.40
0.00
1.49
0.97
9.05
N–N
1.01
3.70
6.44
0.00
1.67
0.93
10.84
C–C C 2 H 4
1.25
3.47
6.96
0.00
X = Y
a
0.89
11.33
C–C C 2 H 2
1.12
4.23
8.80
0.00
1.98
0.97
16.01
C–C C 2
1.18
4.14
8.69
0.00
1.95
1.04
16.61
Cl–Cl
1.89
4.97
11.46
0.00
2.08
1.69
30.41
Li–Li
2.63
3.13
13.67
0.00
2.47
1.23
31.37
Heteronuclear bonds
F–H
0.80
1.71
2.56
−0.07
1.06
0.55
2.58
1.44
1.96
3.08
0.89
1.06
0.90
4.28
Cl–H
1.49
1.40
2.65
−0.28
1.08
0.58
2.80
1.72
1.37
2.58
−0.06
1.08
0.51
2.47
Li–H
2.11
1.46
3.80
−0.38
1.28
0.74
5.03
1.35
1.71
4.80
−0.95
1.28
1.24
8.48
C–O CO 2
1.21
3.29
5.50
−0.29
1.54
0.87
8.61
0.74
3.62
6.35
−1.51
1.54
1.27
12.57
Li–F
2.18
3.18
5.32
−0.84
1.49
0.93
8.67
1.15
4.68
9.73
−3.46
1.49
2.29
21.45
Cl–F
2.14
3.07
5.21
−0.44
1.46
0.99
8.75
1.33
3.87
7.46
−2.34
1.46
1.79
15.94
C–O
1.19
3.54
6.11
−0.13
1.62
0.91
10.09
0.70
3.86
6.89
−1.46
1.62
1.27
14.03
Li–Cl
2.48
4.71
11.03
−0.88
2.16
1.30
25.41
1.30
6.09
16.65
−3.91
2.16
2.70
52.91
67
Reprinted from the journal
1 3
electrons along this ring, due to the electrons residing close
to the bond point or the nonbonding regions.
Critical features can be more easily identifi ed using contour plots of the gradient length of radial density, |∇ρ rad | ,
as shown in Figure S17–S22 of the supporting information.
3.3 Atoms in molecules
AIM properties can be quickly and easily calculated,
including shape, volume [ 19 ], r , r 2 (Table 2 ), and dipole
(Table 3 ). For comparison, these properties are also given
for free atoms and ions in Table S2.
Several intuitive trends can be extracted from these
calculated properties. First of all, as given in Table 2 ,
volume is generally proportional to r 2 . This is consistent with results found by Blair and Thakkar, who
determined that the best correlation between volume
and r 2 for a set of 1641 organic molecules could be
approximated by V ≈ 29.073r 2
1/2
[ 20 ]. Another
observation is that the volume of an AIM in comparison with the free atom and ions follows the same trend
as its ionic state. For example, hydrogen AIM ordered
by volume result in: H
−
2 > H − > LiH > H atom
> H 2 > CH 4 > H 2 O > H
+
2 . As expected, this trend
shows anionic hydrogen tend to be larger than covalently
bonded hydrogen which are subsequently larger than cationic hydrogen. For other heavy atoms, the AIM is generally smaller in volume than the free neutral atom because
Table 5 Expectation values
( r and r 2 ), dipole, size, and
volume of BIM calculated at
both the RBCP (top row) or
DBCP (bottom row) origin ( Z o )
Note that RBCP = DBCP for homonuclear bonds when the BCP coincides with the molecule’s center of
inversion. The BIM are ordered from largest to smallest volume at the RBCP
a S X = 1.90 , S Y = 1.60
Molecule
Size
Volume
A–B
Z o
r
r 2
μ Z
X = Y
Z
Homonuclear bonds
H–H +
0.99
0.41
0.63
0.00
0.53
0.28
0.33
H–H
0.69
0.92
1.61
0.00
0.85
0.39
1.19
C–C C 2 H 6
1.44
2.53
4.60
0.00
1.41
0.79
6.55
F–F
1.25
2.72
4.36
0.00
1.29
1.01
7.07
H–H
0.71
1.42
4.83
0.00
1.42
0.90
7.57
O–O
1.09
3.27
5.40
0.00
1.49
0.97
9.05
N–N
1.01
3.70
6.44
0.00
1.67
0.93
10.84
C–C C 2 H 4
1.25
3.47
6.96
0.00
X = Y
a
0.89
11.33
C–C C 2 H 2
1.12
4.23
8.80
0.00
1.98
0.97
16.01
C–C C 2
1.18
4.14
8.69
0.00
1.95
1.04
16.61
Cl–Cl
1.89
4.97
11.46
0.00
2.08
1.69
30.41
Li–Li
2.63
3.13
13.67
0.00
2.47
1.23
31.37
Heteronuclear bonds
F–H
0.80
1.71
2.56
−0.07
1.06
0.55
2.58
1.44
1.96
3.08
0.89
1.06
0.90
4.28
Cl–H
1.49
1.40
2.65
−0.28
1.08
0.58
2.80
1.72
1.37
2.58
−0.06
1.08
0.51
2.47
Li–H
2.11
1.46
3.80
−0.38
1.28
0.74
5.03
1.35
1.71
4.80
−0.95
1.28
1.24
8.48
C–O CO 2
1.21
3.29
5.50
−0.29
1.54
0.87
8.61
0.74
3.62
6.35
−1.51
1.54
1.27
12.57
Li–F
2.18
3.18
5.32
−0.84
1.49
0.93
8.67
1.15
4.68
9.73
−3.46
1.49
2.29
21.45
Cl–F
2.14
3.07
5.21
−0.44
1.46
0.99
8.75
1.33
3.87
7.46
−2.34
1.46
1.79
15.94
C–O
1.19
3.54
6.11
−0.13
1.62
0.91
10.09
0.70
3.86
6.89
−1.46
1.62
1.27
14.03
Li–Cl
2.48
4.71
11.03
−0.88
2.16
1.30
25.41
1.30
6.09
16.65
−3.91
2.16
2.70
52.91
67
Reprinted from the journal