

Theor Chem Acc (2015) 134:117
1 3
The critical architectures in molecular radial density
provide information on the probability of fi nding electrons
in a particular region such as at a point or along a ring or
sphere. In the neighborhood of a critical architecture, the
probability of fi nding electrons at a maximum is higher
than at a minimum, while fi nding electrons at a saddle has
intermediate probability.
The critical features shown on the contour and gradient
vector fi eld of radial density for F 2 in Fig. 5 are an excellent example of the electron probability distribution information provided by the critical architectures. For comparison, the atomic radial density of a free fl uorine atom
is shown in Fig. 1 . The most signifi cant topological change
occurring in the free fl uorine atom is the distortion of the
maximum sphere in the valence shell. The distortion yields
numerous critical features in F 2 that are connected by a
teardrop-shaped gradient path. The most intuitive feature is
the red maximum bond point which shows a higher probability of electrons in the bonding region. Another intuitive
feature is the red maximum spherical ring, which shows
a high probability of electrons in the nonbonding region.
A buildup of charge probability in the bonding and nonbonding regions cannot occur without a subsequent depletion from another region. The physical signifi cance of the
green saddle ring is to show a lower probability of fi nding
Each group of AIM are ordered from largest to smallest volume
a Terminal H
b Bridging H
Table 2 continued
Atom
Molecule
Shape
Volume
r
r 2
S o
x
S o
y
S o
z
Chlorine
Cl
− ion
3.57
3.57
3.57
190.12
18.87
38.17
CH 3 Cl
3.21
3.21
3.01
129.87
16.67
29.66
ClF
3.13
3.13
3.12
127.95
16.64
29.31
Cl atom
3.04
3.04
3.04
118.08
15.84
27.79
HCl
3.15
3.15
2.82
117.40
16.02
27.83
Cl 2
3.09
3.09
2.85
114.00
15.74
27.23
LiCl
3.09
3.09
2.76
110.31
15.37
26.69
Table 3 Dipole (a.u.) of Li AIM
Molecule
μ z
Li 2
±0.68
LiH
−1.28
LiF
−2.83
LiCl
−2.39
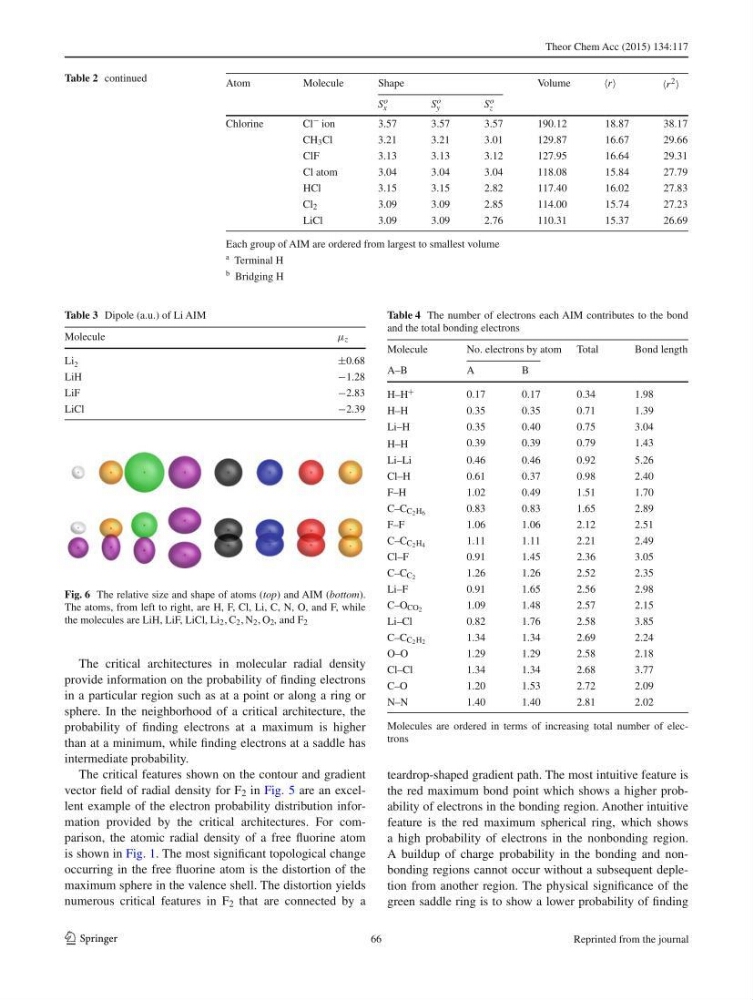
Fig. 6 The relative size and shape of atoms ( top ) and AIM ( bottom ).
The atoms, from left to right, are H, F, Cl, Li, C, N, O, and F, while
the molecules are LiH, LiF, LiCl, Li 2 , C 2 , N 2 , O 2 , and F 2
Table 4 The number of electrons each AIM contributes to the bond
and the total bonding electrons
Molecules are ordered in terms of increasing total number of electrons
Molecule
No. electrons by atom Total
Bond length
A–B
A
B
H–H +
0.17
0.17
0.34
1.98
H–H
0.35
0.35
0.71
1.39
Li–H
0.35
0.40
0.75
3.04
H–H
0.39
0.39
0.79
1.43
Li–Li
0.46
0.46
0.92
5.26
Cl–H
0.61
0.37
0.98
2.40
F–H
1.02
0.49
1.51
1.70
C–C C 2 H 6
0.83
0.83
1.65
2.89
F–F
1.06
1.06
2.12
2.51
C–C C 2 H 4
1.11
1.11
2.21
2.49
Cl–F
0.91
1.45
2.36
3.05
C–C C 2
1.26
1.26
2.52
2.35
Li–F
0.91
1.65
2.56
2.98
C–O CO 2
1.09
1.48
2.57
2.15
Li–Cl
0.82
1.76
2.58
3.85
C–C C 2 H 2
1.34
1.34
2.69
2.24
O–O
1.29
1.29
2.58
2.18
Cl–Cl
1.34
1.34
2.68
3.77
C–O
1.20
1.53
2.72
2.09
N–N
1.40
1.40
2.81
2.02
66
Reprinted from the journal
1 3
The critical architectures in molecular radial density
provide information on the probability of fi nding electrons
in a particular region such as at a point or along a ring or
sphere. In the neighborhood of a critical architecture, the
probability of fi nding electrons at a maximum is higher
than at a minimum, while fi nding electrons at a saddle has
intermediate probability.
The critical features shown on the contour and gradient
vector fi eld of radial density for F 2 in Fig. 5 are an excellent example of the electron probability distribution information provided by the critical architectures. For comparison, the atomic radial density of a free fl uorine atom
is shown in Fig. 1 . The most signifi cant topological change
occurring in the free fl uorine atom is the distortion of the
maximum sphere in the valence shell. The distortion yields
numerous critical features in F 2 that are connected by a
teardrop-shaped gradient path. The most intuitive feature is
the red maximum bond point which shows a higher probability of electrons in the bonding region. Another intuitive
feature is the red maximum spherical ring, which shows
a high probability of electrons in the nonbonding region.
A buildup of charge probability in the bonding and nonbonding regions cannot occur without a subsequent depletion from another region. The physical signifi cance of the
green saddle ring is to show a lower probability of fi nding
Each group of AIM are ordered from largest to smallest volume
a Terminal H
b Bridging H
Table 2 continued
Atom
Molecule
Shape
Volume
r
r 2
S o
x
S o
y
S o
z
Chlorine
Cl
− ion
3.57
3.57
3.57
190.12
18.87
38.17
CH 3 Cl
3.21
3.21
3.01
129.87
16.67
29.66
ClF
3.13
3.13
3.12
127.95
16.64
29.31
Cl atom
3.04
3.04
3.04
118.08
15.84
27.79
HCl
3.15
3.15
2.82
117.40
16.02
27.83
Cl 2
3.09
3.09
2.85
114.00
15.74
27.23
LiCl
3.09
3.09
2.76
110.31
15.37
26.69
Table 3 Dipole (a.u.) of Li AIM
Molecule
μ z
Li 2
±0.68
LiH
−1.28
LiF
−2.83
LiCl
−2.39
Fig. 6 The relative size and shape of atoms ( top ) and AIM ( bottom ).
The atoms, from left to right, are H, F, Cl, Li, C, N, O, and F, while
the molecules are LiH, LiF, LiCl, Li 2 , C 2 , N 2 , O 2 , and F 2
Table 4 The number of electrons each AIM contributes to the bond
and the total bonding electrons
Molecules are ordered in terms of increasing total number of electrons
Molecule
No. electrons by atom Total
Bond length
A–B
A
B
H–H +
0.17
0.17
0.34
1.98
H–H
0.35
0.35
0.71
1.39
Li–H
0.35
0.40
0.75
3.04
H–H
0.39
0.39
0.79
1.43
Li–Li
0.46
0.46
0.92
5.26
Cl–H
0.61
0.37
0.98
2.40
F–H
1.02
0.49
1.51
1.70
C–C C 2 H 6
0.83
0.83
1.65
2.89
F–F
1.06
1.06
2.12
2.51
C–C C 2 H 4
1.11
1.11
2.21
2.49
Cl–F
0.91
1.45
2.36
3.05
C–C C 2
1.26
1.26
2.52
2.35
Li–F
0.91
1.65
2.56
2.98
C–O CO 2
1.09
1.48
2.57
2.15
Li–Cl
0.82
1.76
2.58
3.85
C–C C 2 H 2
1.34
1.34
2.69
2.24
O–O
1.29
1.29
2.58
2.18
Cl–Cl
1.34
1.34
2.68
3.77
C–O
1.20
1.53
2.72
2.09
N–N
1.40
1.40
2.81
2.02
66
Reprinted from the journal