

Theor Chem Acc (2015) 134:128
1 3
energies of the vibrational levels, while in the full calculations they are slightly shifted away from these values. The
reason of this shift has already been discussed in [ 18 ].
Again, we fi nd that at low ( 1 × 10 12 W cm −2 ) intensity
the dissociation probability of the vibrational level ν = 5 is
practically zero (see panel A and B on Fig. 2 ). This fi nding
has already been discussed by us. Namely, in a very special
situation when one of the eigenvalues of the upper adiabatic potential [ 20 ] matches to the energy level of a certain
vibrational eigenstate on the diabatic surface, the nuclear
wave packet can spend a non-negligible amount of time
in the upper adiabatic potential before reaching the dissociation region. The system somehow is being trapped for
a certain time and as a result of it molecular fragments
from this vibrational eigenstate are missing from the spectra. Nevertheless this phenomenon disappears at greater
( 1 × 10 14 W cm −2 ) intensity (see panel C and D on Fig. 2 ),
because of the shift of the eigenvalues of the upper adiabatic potential due to the modifi cation of its shape caused by
the increased intensity.
3.2 Angular distribution and wave packet density
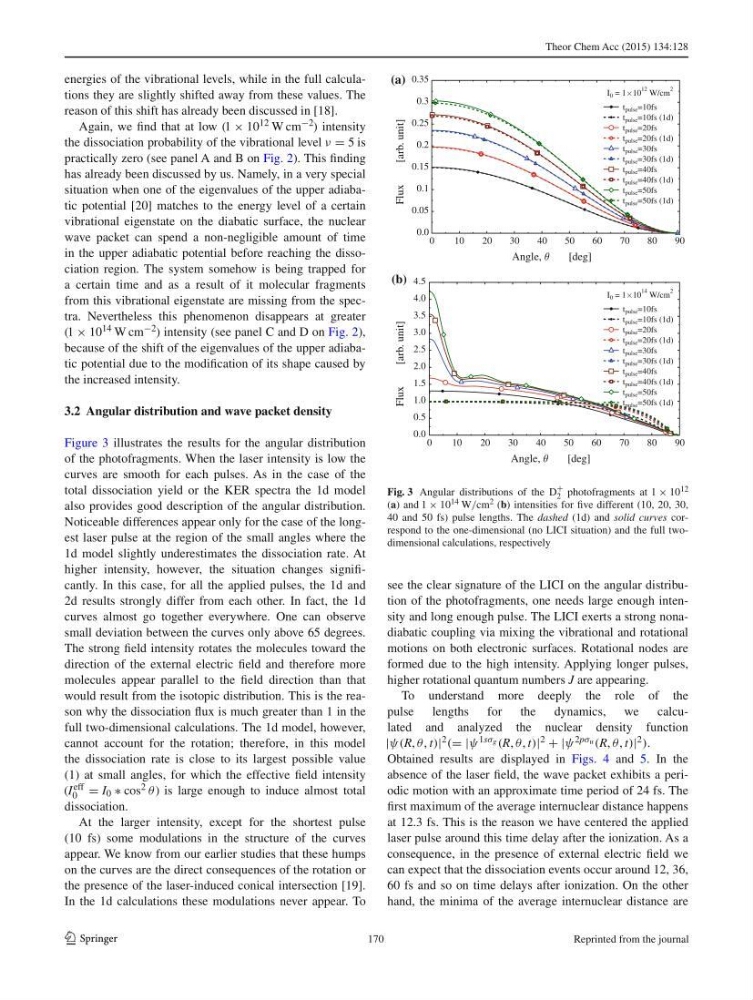
Figure 3 illustrates the results for the angular distribution
of the photofragments. When the laser intensity is low the
curves are smooth for each pulses. As in the case of the
total dissociation yield or the KER spectra the 1d model
also provides good description of the angular distribution.
Noticeable differences appear only for the case of the longest laser pulse at the region of the small angles where the
1d model slightly underestimates the dissociation rate. At
higher intensity, however, the situation changes signifi -
cantly. In this case, for all the applied pulses, the 1d and
2d results strongly differ from each other. In fact, the 1d
curves almost go together everywhere. One can observe
small deviation between the curves only above 65 degrees.
The strong fi eld intensity rotates the molecules toward the
direction of the external electric fi eld and therefore more
molecules appear parallel to the fi eld direction than that
would result from the isotopic distribution. This is the reason why the dissociation fl ux is much greater than 1 in the
full two-dimensional calculations. The 1d model, however,
cannot account for the rotation; therefore, in this model
the dissociation rate is close to its largest possible value
(1) at small angles, for which the effective fi eld intensity
(I eff
0 = I 0 ∗ cos 2 θ) is large enough to induce almost total
dissociation.
At the larger intensity, except for the shortest pulse
(10 fs) some modulations in the structure of the curves
appear. We know from our earlier studies that these humps
on the curves are the direct consequences of the rotation or
the presence of the laser-induced conical intersection [ 19 ].
In the 1d calculations these modulations never appear. To
see the clear signature of the LICI on the angular distribution of the photofragments, one needs large enough intensity and long enough pulse. The LICI exerts a strong nonadiabatic coupling via mixing the vibrational and rotational
motions on both electronic surfaces. Rotational nodes are
formed due to the high intensity. Applying longer pulses,
higher rotational quantum numbers J are appearing.
To understand more deeply the role of the
pulse lengths for the dynamics, we calculated and analyzed the nuclear density function
|ψ(R, θ , t)| 2 (= |ψ 1sσ g (R, θ , t)| 2 + |ψ 2pσ u (R, θ , t)| 2 ).
Obtained results are displayed in Figs. 4 and 5 . In the
absence of the laser fi eld, the wave packet exhibits a periodic motion with an approximate time period of 24 fs. The
fi rst maximum of the average internuclear distance happens
at 12.3 fs. This is the reason we have centered the applied
laser pulse around this time delay after the ionization. As a
consequence, in the presence of external electric fi eld we
can expect that the dissociation events occur around 12, 36,
60 fs and so on time delays after ionization. On the other
hand, the minima of the average internuclear distance are
0.0
0.05
0.1
0.15
0.2
0.25
0.3
0.35
Flux
[arb. unit]
Angle,
[deg]
t pulse =10fs
t pulse =10fs (1d)
t pulse =20fs
t pulse =20fs (1d)
t pulse =30fs
t pulse =30fs (1d)
t pulse =40fs
t pulse =40fs (1d)
t pulse =50fs
t pulse =50fs (1d)
I 0 = 1 10
12 W/cm
2
0.0
0.5
1.0
1.5
2.0
2.5
3.0
3.5
4.0
4.5
Flux
[arb. unit]
0
10
20
30
40
50
60
70
80
90
0
10
20
30
40
50
60
70
80
90
Angle,
[deg]
t pulse =10fs
t pulse =10fs (1d)
t pulse =20fs
t pulse =20fs (1d)
t pulse =30fs
t pulse =30fs (1d)
t pulse =40fs
t pulse =40fs (1d)
t pulse =50fs
t pulse =50fs (1d)
I 0 = 1 10
14 W/cm
2
(a)
(b)
Fig. 3 Angular distributions of the D
+
2 photofragments at 1 × 10 12
( a ) and 1 × 10 14 W/cm 2 ( b ) intensities for fi ve different (10, 20, 30,
40 and 50 fs) pulse lengths. The dashed (1d) and solid curves correspond to the one-dimensional (no LICI situation) and the full twodimensional calculations, respectively
170
Reprinted from the journal
1 3
energies of the vibrational levels, while in the full calculations they are slightly shifted away from these values. The
reason of this shift has already been discussed in [ 18 ].
Again, we fi nd that at low ( 1 × 10 12 W cm −2 ) intensity
the dissociation probability of the vibrational level ν = 5 is
practically zero (see panel A and B on Fig. 2 ). This fi nding
has already been discussed by us. Namely, in a very special
situation when one of the eigenvalues of the upper adiabatic potential [ 20 ] matches to the energy level of a certain
vibrational eigenstate on the diabatic surface, the nuclear
wave packet can spend a non-negligible amount of time
in the upper adiabatic potential before reaching the dissociation region. The system somehow is being trapped for
a certain time and as a result of it molecular fragments
from this vibrational eigenstate are missing from the spectra. Nevertheless this phenomenon disappears at greater
( 1 × 10 14 W cm −2 ) intensity (see panel C and D on Fig. 2 ),
because of the shift of the eigenvalues of the upper adiabatic potential due to the modifi cation of its shape caused by
the increased intensity.
3.2 Angular distribution and wave packet density
Figure 3 illustrates the results for the angular distribution
of the photofragments. When the laser intensity is low the
curves are smooth for each pulses. As in the case of the
total dissociation yield or the KER spectra the 1d model
also provides good description of the angular distribution.
Noticeable differences appear only for the case of the longest laser pulse at the region of the small angles where the
1d model slightly underestimates the dissociation rate. At
higher intensity, however, the situation changes signifi -
cantly. In this case, for all the applied pulses, the 1d and
2d results strongly differ from each other. In fact, the 1d
curves almost go together everywhere. One can observe
small deviation between the curves only above 65 degrees.
The strong fi eld intensity rotates the molecules toward the
direction of the external electric fi eld and therefore more
molecules appear parallel to the fi eld direction than that
would result from the isotopic distribution. This is the reason why the dissociation fl ux is much greater than 1 in the
full two-dimensional calculations. The 1d model, however,
cannot account for the rotation; therefore, in this model
the dissociation rate is close to its largest possible value
(1) at small angles, for which the effective fi eld intensity
(I eff
0 = I 0 ∗ cos 2 θ) is large enough to induce almost total
dissociation.
At the larger intensity, except for the shortest pulse
(10 fs) some modulations in the structure of the curves
appear. We know from our earlier studies that these humps
on the curves are the direct consequences of the rotation or
the presence of the laser-induced conical intersection [ 19 ].
In the 1d calculations these modulations never appear. To
see the clear signature of the LICI on the angular distribution of the photofragments, one needs large enough intensity and long enough pulse. The LICI exerts a strong nonadiabatic coupling via mixing the vibrational and rotational
motions on both electronic surfaces. Rotational nodes are
formed due to the high intensity. Applying longer pulses,
higher rotational quantum numbers J are appearing.
To understand more deeply the role of the
pulse lengths for the dynamics, we calculated and analyzed the nuclear density function
|ψ(R, θ , t)| 2 (= |ψ 1sσ g (R, θ , t)| 2 + |ψ 2pσ u (R, θ , t)| 2 ).
Obtained results are displayed in Figs. 4 and 5 . In the
absence of the laser fi eld, the wave packet exhibits a periodic motion with an approximate time period of 24 fs. The
fi rst maximum of the average internuclear distance happens
at 12.3 fs. This is the reason we have centered the applied
laser pulse around this time delay after the ionization. As a
consequence, in the presence of external electric fi eld we
can expect that the dissociation events occur around 12, 36,
60 fs and so on time delays after ionization. On the other
hand, the minima of the average internuclear distance are
0.0
0.05
0.1
0.15
0.2
0.25
0.3
0.35
Flux
[arb. unit]
Angle,
[deg]
t pulse =10fs
t pulse =10fs (1d)
t pulse =20fs
t pulse =20fs (1d)
t pulse =30fs
t pulse =30fs (1d)
t pulse =40fs
t pulse =40fs (1d)
t pulse =50fs
t pulse =50fs (1d)
I 0 = 1 10
12 W/cm
2
0.0
0.5
1.0
1.5
2.0
2.5
3.0
3.5
4.0
4.5
Flux
[arb. unit]
0
10
20
30
40
50
60
70
80
90
0
10
20
30
40
50
60
70
80
90
Angle,
[deg]
t pulse =10fs
t pulse =10fs (1d)
t pulse =20fs
t pulse =20fs (1d)
t pulse =30fs
t pulse =30fs (1d)
t pulse =40fs
t pulse =40fs (1d)
t pulse =50fs
t pulse =50fs (1d)
I 0 = 1 10
14 W/cm
2
(a)
(b)
Fig. 3 Angular distributions of the D
+
2 photofragments at 1 × 10 12
( a ) and 1 × 10 14 W/cm 2 ( b ) intensities for fi ve different (10, 20, 30,
40 and 50 fs) pulse lengths. The dashed (1d) and solid curves correspond to the one-dimensional (no LICI situation) and the full twodimensional calculations, respectively
170
Reprinted from the journal