

Theor Chem Acc (2015) 134:128
1 3
period. This part of the dissociated particles hardly collects
any information about the ground electronic PES of the
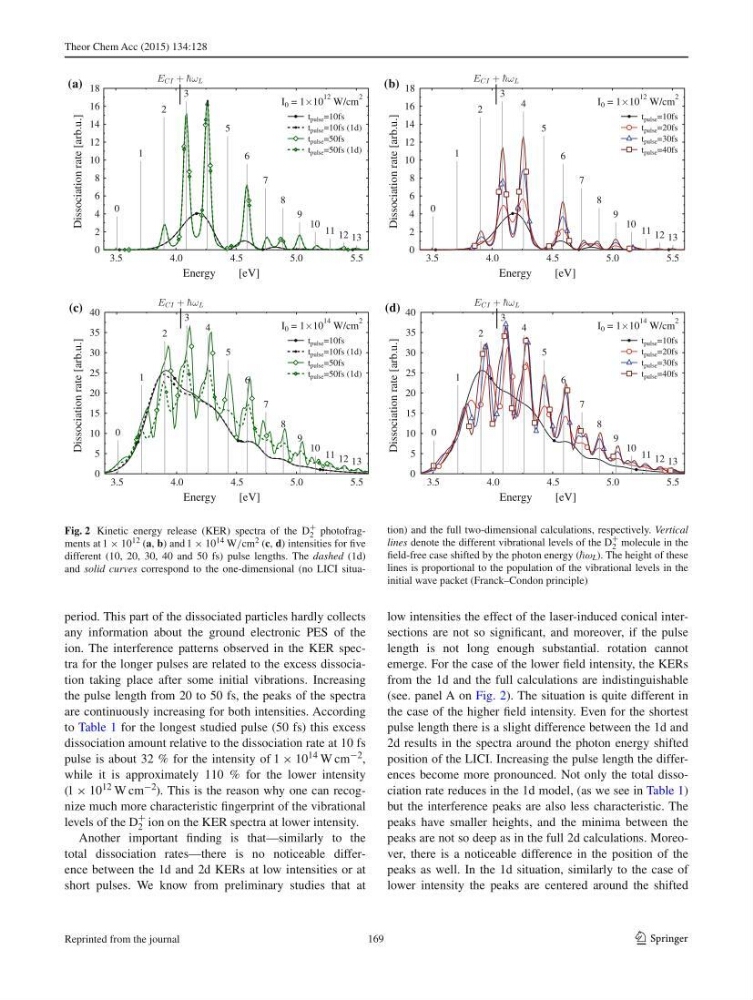
ion. The interference patterns observed in the KER spectra for the longer pulses are related to the excess dissociation taking place after some initial vibrations. Increasing
the pulse length from 20 to 50 fs, the peaks of the spectra
are continuously increasing for both intensities. According
to Table 1 for the longest studied pulse (50 fs) this excess
dissociation amount relative to the dissociation rate at 10 fs
pulse is about 32 % for the intensity of 1 × 10 14 W cm −2 ,
while it is approximately 110 % for the lower intensity
( 1 × 10 12 W cm −2 ). This is the reason why one can recognize much more characteristic fi ngerprint of the vibrational
levels of the D
+
2 ion on the KER spectra at lower intensity.
Another important fi nding is that—similarly to the
total dissociation rates—there is no noticeable difference between the 1d and 2d KERs at low intensities or at
short pulses. We know from preliminary studies that at
low intensities the effect of the laser-induced conical intersections are not so signifi cant, and moreover, if the pulse
length is not long enough substantial. rotation cannot
emerge. For the case of the lower fi eld intensity, the KERs
from the 1d and the full calculations are indistinguishable
(see. panel A on Fig. 2 ). The situation is quite different in
the case of the higher fi eld intensity. Even for the shortest
pulse length there is a slight difference between the 1d and
2d results in the spectra around the photon energy shifted
position of the LICI. Increasing the pulse length the differences become more pronounced. Not only the total dissociation rate reduces in the 1d model, (as we see in Table 1 )
but the interference peaks are also less characteristic. The
peaks have smaller heights, and the minima between the
peaks are not so deep as in the full 2d calculations. Moreover, there is a noticeable difference in the position of the
peaks as well. In the 1d situation, similarly to the case of
lower intensity the peaks are centered around the shifted
0
2
4
6
8
10
12
14
16
18
Dissociation rate [arb.u.]
Energy
[eV]
t pulse =10fs
t pulse =10fs (1d)
t pulse =50fs
t pulse =50fs (1d)
I 0 = 1 10
12 W/cm
2
0
1
2
3
4
5
6
7
8
9
10 11 12 13
(a)
E CI + ¯
hω L
0
2
4
6
8
10
12
14
16
18
Dissociation rate [arb.u.]
Energy
[eV]
t pulse =10fs
t pulse =20fs
t pulse =30fs
t pulse =40fs
I 0 = 1 10
12 W/cm
2
0
1
2
3
4
5
6
7
8
9
10 11 12 13
(b)
E CI + ¯
hω L
0
5
10
15
20
25
30
35
40
Dissociation rate [arb.u.]
Energy
[eV]
t pulse =10fs
t pulse =10fs (1d)
t pulse =50fs
t pulse =50fs (1d)
I 0 = 1 10
14 W/cm
2
0
1
2
3
4
5
6
7
8
9
10 11 12 13
(c)
E CI + ¯
hω L
0
5
10
15
20
25
30
35
40
Dissociation rate [arb.u.]
3.5
4.0
4.5
5.0
5.5
3.5
4.0
4.5
5.0
5.5
3.5
4.0
4.5
5.0
5.5
3.5
4.0
4.5
5.0
5.5
Energy
[eV]
t pulse =10fs
t pulse =20fs
t pulse =30fs
t pulse =40fs
I 0 = 1 10
14 W/cm
2
0
1
2
3
4
5
6
7
8
9
10 11 12 13
(d)
E CI + ¯
hω L
Fig. 2 Kinetic energy release (KER) spectra of the D
+
2 photofragments at 1 × 10 12 ( a , b ) and 1 × 10 14 W/cm 2 ( c , d ) intensities for fi ve
different (10, 20, 30, 40 and 50 fs) pulse lengths. The dashed (1d)
and solid curves correspond to the one-dimensional (no LICI situation) and the full two-dimensional calculations, respectively. Vertical
lines denote the different vibrational levels of the D
+
2 molecule in the
fi eld-free case shifted by the photon energy ( ω L ). The height of these
lines is proportional to the population of the vibrational levels in the
initial wave packet (Franck–Condon principle)
169
Reprinted from the journal
1 3
period. This part of the dissociated particles hardly collects
any information about the ground electronic PES of the
ion. The interference patterns observed in the KER spectra for the longer pulses are related to the excess dissociation taking place after some initial vibrations. Increasing
the pulse length from 20 to 50 fs, the peaks of the spectra
are continuously increasing for both intensities. According
to Table 1 for the longest studied pulse (50 fs) this excess
dissociation amount relative to the dissociation rate at 10 fs
pulse is about 32 % for the intensity of 1 × 10 14 W cm −2 ,
while it is approximately 110 % for the lower intensity
( 1 × 10 12 W cm −2 ). This is the reason why one can recognize much more characteristic fi ngerprint of the vibrational
levels of the D
+
2 ion on the KER spectra at lower intensity.
Another important fi nding is that—similarly to the
total dissociation rates—there is no noticeable difference between the 1d and 2d KERs at low intensities or at
short pulses. We know from preliminary studies that at
low intensities the effect of the laser-induced conical intersections are not so signifi cant, and moreover, if the pulse
length is not long enough substantial. rotation cannot
emerge. For the case of the lower fi eld intensity, the KERs
from the 1d and the full calculations are indistinguishable
(see. panel A on Fig. 2 ). The situation is quite different in
the case of the higher fi eld intensity. Even for the shortest
pulse length there is a slight difference between the 1d and
2d results in the spectra around the photon energy shifted
position of the LICI. Increasing the pulse length the differences become more pronounced. Not only the total dissociation rate reduces in the 1d model, (as we see in Table 1 )
but the interference peaks are also less characteristic. The
peaks have smaller heights, and the minima between the
peaks are not so deep as in the full 2d calculations. Moreover, there is a noticeable difference in the position of the
peaks as well. In the 1d situation, similarly to the case of
lower intensity the peaks are centered around the shifted
0
2
4
6
8
10
12
14
16
18
Dissociation rate [arb.u.]
Energy
[eV]
t pulse =10fs
t pulse =10fs (1d)
t pulse =50fs
t pulse =50fs (1d)
I 0 = 1 10
12 W/cm
2
0
1
2
3
4
5
6
7
8
9
10 11 12 13
(a)
E CI + ¯
hω L
0
2
4
6
8
10
12
14
16
18
Dissociation rate [arb.u.]
Energy
[eV]
t pulse =10fs
t pulse =20fs
t pulse =30fs
t pulse =40fs
I 0 = 1 10
12 W/cm
2
0
1
2
3
4
5
6
7
8
9
10 11 12 13
(b)
E CI + ¯
hω L
0
5
10
15
20
25
30
35
40
Dissociation rate [arb.u.]
Energy
[eV]
t pulse =10fs
t pulse =10fs (1d)
t pulse =50fs
t pulse =50fs (1d)
I 0 = 1 10
14 W/cm
2
0
1
2
3
4
5
6
7
8
9
10 11 12 13
(c)
E CI + ¯
hω L
0
5
10
15
20
25
30
35
40
Dissociation rate [arb.u.]
3.5
4.0
4.5
5.0
5.5
3.5
4.0
4.5
5.0
5.5
3.5
4.0
4.5
5.0
5.5
3.5
4.0
4.5
5.0
5.5
Energy
[eV]
t pulse =10fs
t pulse =20fs
t pulse =30fs
t pulse =40fs
I 0 = 1 10
14 W/cm
2
0
1
2
3
4
5
6
7
8
9
10 11 12 13
(d)
E CI + ¯
hω L
Fig. 2 Kinetic energy release (KER) spectra of the D
+
2 photofragments at 1 × 10 12 ( a , b ) and 1 × 10 14 W/cm 2 ( c , d ) intensities for fi ve
different (10, 20, 30, 40 and 50 fs) pulse lengths. The dashed (1d)
and solid curves correspond to the one-dimensional (no LICI situation) and the full two-dimensional calculations, respectively. Vertical
lines denote the different vibrational levels of the D
+
2 molecule in the
fi eld-free case shifted by the photon energy ( ω L ). The height of these
lines is proportional to the population of the vibrational levels in the
initial wave packet (Franck–Condon principle)
169
Reprinted from the journal