

Theor Chem Acc (2015) 134:116
1 3
Raman spectrum, in 1 , the computations predict three relatively close levels in IR around ∼955 cm
−1 from which
two are also active in the Raman spectrum. In addition, a
single frequency in this region corresponding to the symmetric stretching of the VO 2 group appears in mere Raman
spectrum. In 3 , the four V–O t stretching modes should
be active in both spectra, while the highest wave number
(∼978 cm
−1
) is dominant in the Raman and the lower frequencies are dominated in IR spectra.
V–O h stretchings have not appeared in the investigated
range for 1 with pseudo-hexacoordinated vanadium atom,
and the O h –H stretching frequencies remain in their usual
range. This behavior and the V–O h bond length confi rm
a very weak bonding character for this bond. In 2 , the V–
O h stretchings dominantly contribute to IR bands around
660 cm
−1 and in Raman spectrum around 625 cm
−1 . In 3 ,
those stretchings contribute to frequencies around ∼550–
600 cm
−1 together with the V–O b stretchings and other
skeletal bendings. IR bands at ∼800 and ∼770 cm
−1 are
mostly attributed to involvement of the V–O b stretchings,
as well as a medium intensity band in this region of the
Raman spectrum.
4.2.2 UV–Vis and ECD spectra
In the range of 180–500 nm, there are about 90, 130, and
250 calculated singlet electronic transitions for 1 , 2 , and
3 , respectively. As these spectra are dominated by LMCT
transitions (charge transfer from ligand to metal), in this
case, we have used long-range corrected functionals [ 59 ]
combined with BP86/WI-optimized geometries. We have
checked the M06/WI-optimized structures, too, but the differences are negligible.
Our calculations and some new experimental data complement the UV–Vis spectra published in [ 16 ]. We are
aware that the calculated values are still infl uenced by several approximations that might be quite crude but which are
not easy to eliminate in a cost-effective way. First of all, the
calculated spectra correspond to vertical transitions without
vibronic couplings. Moreover, in order to simulate the environment we have used a standard PCM model, but for more
accurate computations of excitation spectra the response
of the environment to the excitation should be included
either perturbatively, as, e.g., done within the corrected linear response (cLR) scheme [ 60 , 61 ], or in a self-consistent
manner within the state-specifi c (SS-PCM) scheme [ 62 ,
63 ].
Let us fi rst discuss the complex 3 , for which we were
able to measure the ECD (together with UV–Vis) spectra, as shown in Fig. 3 . In Fig. 4 , we display the simulated
spectra using CAM-B3LYP and LC- ω PBE functionals with
extended WII basis sets (see below a comment on the basis
set effect). Here, we have skipped results obtained with
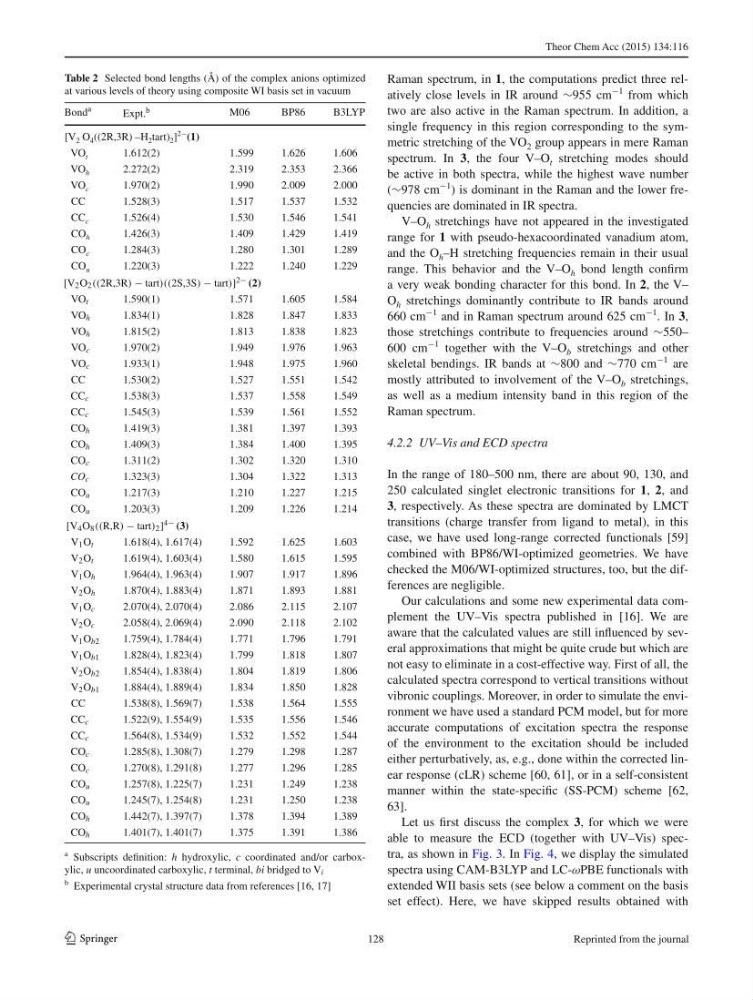
Table 2 Selected bond lengths (Å) of the complex anions optimized
at various levels of theory using composite WI basis set in vacuum
a Subscripts defi nition: h hydroxylic, c coordinated and/or carboxylic, u uncoordinated carboxylic, t terminal, bi bridged to V i
b Experimental crystal structure data from references [ 16 , 17 ]
Bond
a
Expt. b
M06
BP86
B3LYP
[V 2 O 4 ((2R,3R) –H 2 tart) 2 ]
2− (1)
VO t
1.612(2)
1.599
1.626
1.606
VO h
2.272(2)
2.319
2.353
2.366
VO c
1.970(2)
1.990
2.009
2.000
CC
1.528(3)
1.517
1.537
1.532
CC c
1.526(4)
1.530
1.546
1.541
CO h
1.426(3)
1.409
1.429
1.419
CO c
1.284(3)
1.280
1.301
1.289
CO u
1.220(3)
1.222
1.240
1.229
[V 2 O 2 ((2R,3R) − tart)((2S,3S) − tart)] 2− (2)
VO t
1.590(1)
1.571
1.605
1.584
VO h
1.834(1)
1.828
1.847
1.833
VO h
1.815(2)
1.813
1.838
1.823
VO c
1.970(2)
1.949
1.976
1.963
VO c
1.933(1)
1.948
1.975
1.960
CC
1.530(2)
1.527
1.551
1.542
CC c
1.538(3)
1.537
1.558
1.549
CC c
1.545(3)
1.539
1.561
1.552
CO h
1.419(3)
1.381
1.397
1.393
CO h
1.409(3)
1.384
1.400
1.395
CO c
1.311(2)
1.302
1.320
1.310
CO c
1.323(3)
1.304
1.322
1.313
CO u
1.217(3)
1.210
1.227
1.215
CO u
1.203(3)
1.209
1.226
1.214
[V 4 O 8 ((R,R) − tart) 2 ] 4− (3)
V 1 O t
1.618(4), 1.617(4)
1.592
1.625
1.603
V 2 O t
1.619(4), 1.603(4)
1.580
1.615
1.595
V 1 O h
1.964(4), 1.963(4)
1.907
1.917
1.896
V 2 O h
1.870(4), 1.883(4)
1.871
1.893
1.881
V 1 O c
2.070(4), 2.070(4)
2.086
2.115
2.107
V 2 O c
2.058(4), 2.069(4)
2.090
2.118
2.102
V 1 O b2
1.759(4), 1.784(4)
1.771
1.796
1.791
V 1 O b1
1.828(4), 1.823(4)
1.799
1.818
1.807
V 2 O b2
1.854(4), 1.838(4)
1.804
1.819
1.806
V 2 O b1
1.884(4), 1.889(4)
1.834
1.850
1.828
CC
1.538(8), 1.569(7)
1.538
1.564
1.555
CC c
1.522(9), 1.554(9)
1.535
1.556
1.546
CC c
1.564(8), 1.534(9)
1.532
1.552
1.544
CO c
1.285(8), 1.308(7)
1.279
1.298
1.287
CO c
1.270(8), 1.291(8)
1.277
1.296
1.285
CO u
1.257(8), 1.225(7)
1.231
1.249
1.238
CO u
1.245(7), 1.254(8)
1.231
1.250
1.238
CO h
1.442(7), 1.397(7)
1.378
1.394
1.389
CO h
1.401(7), 1.401(7)
1.375
1.391
1.386
128
Reprinted from the journal
1 3
Raman spectrum, in 1 , the computations predict three relatively close levels in IR around ∼955 cm
−1 from which
two are also active in the Raman spectrum. In addition, a
single frequency in this region corresponding to the symmetric stretching of the VO 2 group appears in mere Raman
spectrum. In 3 , the four V–O t stretching modes should
be active in both spectra, while the highest wave number
(∼978 cm
−1
) is dominant in the Raman and the lower frequencies are dominated in IR spectra.
V–O h stretchings have not appeared in the investigated
range for 1 with pseudo-hexacoordinated vanadium atom,
and the O h –H stretching frequencies remain in their usual
range. This behavior and the V–O h bond length confi rm
a very weak bonding character for this bond. In 2 , the V–
O h stretchings dominantly contribute to IR bands around
660 cm
−1 and in Raman spectrum around 625 cm
−1 . In 3 ,
those stretchings contribute to frequencies around ∼550–
600 cm
−1 together with the V–O b stretchings and other
skeletal bendings. IR bands at ∼800 and ∼770 cm
−1 are
mostly attributed to involvement of the V–O b stretchings,
as well as a medium intensity band in this region of the
Raman spectrum.
4.2.2 UV–Vis and ECD spectra
In the range of 180–500 nm, there are about 90, 130, and
250 calculated singlet electronic transitions for 1 , 2 , and
3 , respectively. As these spectra are dominated by LMCT
transitions (charge transfer from ligand to metal), in this
case, we have used long-range corrected functionals [ 59 ]
combined with BP86/WI-optimized geometries. We have
checked the M06/WI-optimized structures, too, but the differences are negligible.
Our calculations and some new experimental data complement the UV–Vis spectra published in [ 16 ]. We are
aware that the calculated values are still infl uenced by several approximations that might be quite crude but which are
not easy to eliminate in a cost-effective way. First of all, the
calculated spectra correspond to vertical transitions without
vibronic couplings. Moreover, in order to simulate the environment we have used a standard PCM model, but for more
accurate computations of excitation spectra the response
of the environment to the excitation should be included
either perturbatively, as, e.g., done within the corrected linear response (cLR) scheme [ 60 , 61 ], or in a self-consistent
manner within the state-specifi c (SS-PCM) scheme [ 62 ,
63 ].
Let us fi rst discuss the complex 3 , for which we were
able to measure the ECD (together with UV–Vis) spectra, as shown in Fig. 3 . In Fig. 4 , we display the simulated
spectra using CAM-B3LYP and LC- ω PBE functionals with
extended WII basis sets (see below a comment on the basis
set effect). Here, we have skipped results obtained with
Table 2 Selected bond lengths (Å) of the complex anions optimized
at various levels of theory using composite WI basis set in vacuum
a Subscripts defi nition: h hydroxylic, c coordinated and/or carboxylic, u uncoordinated carboxylic, t terminal, bi bridged to V i
b Experimental crystal structure data from references [ 16 , 17 ]
Bond
a
Expt. b
M06
BP86
B3LYP
[V 2 O 4 ((2R,3R) –H 2 tart) 2 ]
2− (1)
VO t
1.612(2)
1.599
1.626
1.606
VO h
2.272(2)
2.319
2.353
2.366
VO c
1.970(2)
1.990
2.009
2.000
CC
1.528(3)
1.517
1.537
1.532
CC c
1.526(4)
1.530
1.546
1.541
CO h
1.426(3)
1.409
1.429
1.419
CO c
1.284(3)
1.280
1.301
1.289
CO u
1.220(3)
1.222
1.240
1.229
[V 2 O 2 ((2R,3R) − tart)((2S,3S) − tart)] 2− (2)
VO t
1.590(1)
1.571
1.605
1.584
VO h
1.834(1)
1.828
1.847
1.833
VO h
1.815(2)
1.813
1.838
1.823
VO c
1.970(2)
1.949
1.976
1.963
VO c
1.933(1)
1.948
1.975
1.960
CC
1.530(2)
1.527
1.551
1.542
CC c
1.538(3)
1.537
1.558
1.549
CC c
1.545(3)
1.539
1.561
1.552
CO h
1.419(3)
1.381
1.397
1.393
CO h
1.409(3)
1.384
1.400
1.395
CO c
1.311(2)
1.302
1.320
1.310
CO c
1.323(3)
1.304
1.322
1.313
CO u
1.217(3)
1.210
1.227
1.215
CO u
1.203(3)
1.209
1.226
1.214
[V 4 O 8 ((R,R) − tart) 2 ] 4− (3)
V 1 O t
1.618(4), 1.617(4)
1.592
1.625
1.603
V 2 O t
1.619(4), 1.603(4)
1.580
1.615
1.595
V 1 O h
1.964(4), 1.963(4)
1.907
1.917
1.896
V 2 O h
1.870(4), 1.883(4)
1.871
1.893
1.881
V 1 O c
2.070(4), 2.070(4)
2.086
2.115
2.107
V 2 O c
2.058(4), 2.069(4)
2.090
2.118
2.102
V 1 O b2
1.759(4), 1.784(4)
1.771
1.796
1.791
V 1 O b1
1.828(4), 1.823(4)
1.799
1.818
1.807
V 2 O b2
1.854(4), 1.838(4)
1.804
1.819
1.806
V 2 O b1
1.884(4), 1.889(4)
1.834
1.850
1.828
CC
1.538(8), 1.569(7)
1.538
1.564
1.555
CC c
1.522(9), 1.554(9)
1.535
1.556
1.546
CC c
1.564(8), 1.534(9)
1.532
1.552
1.544
CO c
1.285(8), 1.308(7)
1.279
1.298
1.287
CO c
1.270(8), 1.291(8)
1.277
1.296
1.285
CO u
1.257(8), 1.225(7)
1.231
1.249
1.238
CO u
1.245(7), 1.254(8)
1.231
1.250
1.238
CO h
1.442(7), 1.397(7)
1.378
1.394
1.389
CO h
1.401(7), 1.401(7)
1.375
1.391
1.386
128
Reprinted from the journal