

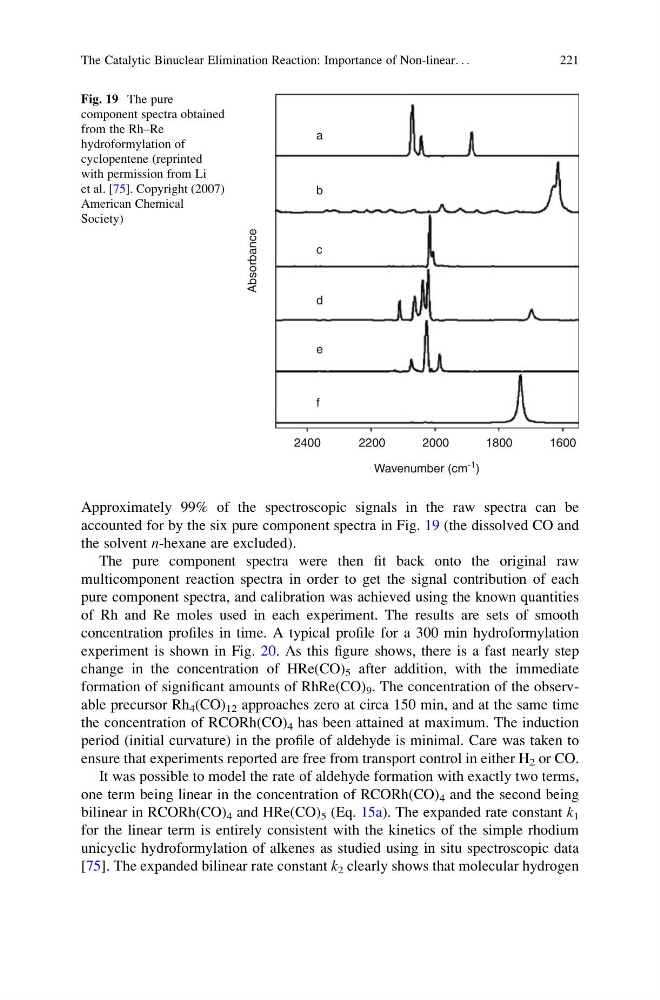
Approximately 99% of the spectroscopic signals in the raw spectra can be
accounted for by the six pure component spectra in Fig. 19 (the dissolved CO and
the solvent n-hexane are excluded).
The pure component spectra were then fit back onto the original raw
multicomponent reaction spectra in order to get the signal contribution of each
pure component spectra, and calibration was achieved using the known quantities
of Rh and Re moles used in each experiment. The results are sets of smooth
concentration profiles in time. A typical profile for a 300 min hydroformylation
experiment is shown in Fig. 20. As this figure shows, there is a fast nearly step
change in the concentration of HRe(CO) 5 after addition, with the immediate
formation of significant amounts of RhRe(CO) 9 . The concentration of the observable precursor Rh 4 (CO) 12 approaches zero at circa 150 min, and at the same time
the concentration of RCORh(CO) 4 has been attained at maximum. The induction
period (initial curvature) in the profile of aldehyde is minimal. Care was taken to
ensure that experiments reported are free from transport control in either H 2 or CO.
It was possible to model the rate of aldehyde formation with exactly two terms,
one term being linear in the concentration of RCORh(CO) 4 and the second being
bilinear in RCORh(CO) 4 and HRe(CO) 5 (Eq. 15a). The expanded rate constant k 1
for the linear term is entirely consistent with the kinetics of the simple rhodium
unicyclic hydroformylation of alkenes as studied using in situ spectroscopic data
[75]. The expanded bilinear rate constant k 2 clearly shows that molecular hydrogen
2400
a
b
c
d
e
f
2200
Wavenumber (cm
-1 )
Absorbance
2000
1800
1600
Fig. 19 The pure
component spectra obtained
from the Rh–Re
hydroformylation of
cyclopentene (reprinted
with permission from Li
et al. [75]. Copyright (2007)
American Chemical
Society)
The Catalytic Binuclear Elimination Reaction: Importance of Non-linear. . .
221
accounted for by the six pure component spectra in Fig. 19 (the dissolved CO and
the solvent n-hexane are excluded).
The pure component spectra were then fit back onto the original raw
multicomponent reaction spectra in order to get the signal contribution of each
pure component spectra, and calibration was achieved using the known quantities
of Rh and Re moles used in each experiment. The results are sets of smooth
concentration profiles in time. A typical profile for a 300 min hydroformylation
experiment is shown in Fig. 20. As this figure shows, there is a fast nearly step
change in the concentration of HRe(CO) 5 after addition, with the immediate
formation of significant amounts of RhRe(CO) 9 . The concentration of the observable precursor Rh 4 (CO) 12 approaches zero at circa 150 min, and at the same time
the concentration of RCORh(CO) 4 has been attained at maximum. The induction
period (initial curvature) in the profile of aldehyde is minimal. Care was taken to
ensure that experiments reported are free from transport control in either H 2 or CO.
It was possible to model the rate of aldehyde formation with exactly two terms,
one term being linear in the concentration of RCORh(CO) 4 and the second being
bilinear in RCORh(CO) 4 and HRe(CO) 5 (Eq. 15a). The expanded rate constant k 1
for the linear term is entirely consistent with the kinetics of the simple rhodium
unicyclic hydroformylation of alkenes as studied using in situ spectroscopic data
[75]. The expanded bilinear rate constant k 2 clearly shows that molecular hydrogen
2400
a
b
c
d
e
f
2200
Wavenumber (cm
-1 )
Absorbance
2000
1800
1600
Fig. 19 The pure
component spectra obtained
from the Rh–Re
hydroformylation of
cyclopentene (reprinted
with permission from Li
et al. [75]. Copyright (2007)
American Chemical
Society)
The Catalytic Binuclear Elimination Reaction: Importance of Non-linear. . .
221