

The reasonable success of RSCF-CV-DFT is based on its well documented
ability to afford good estimates of ionization potentials (IP) and electron affinities
(EA) even for simple local functionals after orbital relaxation has been taken into
account [66]. In adiabatic time-dependent density functional theory (ATDDFT)
based on regular functionals, both IP and -EA are poorly described with errors of up
to 5 eV [66]. In the transition energy (ΔE ¼ IP À EA) these errors are cancelled to
some degree. However, ΔE still carries an error exceeding 1 eV [66].
2.5.3 Application of RSCF-CV(1)-DFT to Charge Transfer
Transitions
It has been demonstrated that regular adiabatic TDDFT employing the general
gradient approximation (GGA) as well as hybrid functionals with a fraction (α) of
exact Hartree–Fock exchange included 0:0 α 0:5
ð
Þ underestimate charge
transfer excitation energies by as much as 2–4 eV [24, 25, 33]. This failure has
been discussed and analyzed extensively [24, 25, 32, 33]. By contrast, ATDDFT in
conjunction with long range corrected (LC) functionals affords charge transfer
excitation energies in good agreement with experiment [33]. In these functionals,
Hartree–Fock exchange is given a growing weight towards longer inter-electronic
distances.
We have recently [30] applied the RSCF-CV(1)-DFT scheme to a series of
charge transfer molecular complexes (CTMC) of the type X-TCNE where an
aromatic molecule (X ¼ benzene, toluene, o-xylene, naphthalene, anthracene) is
bound to tetracyanoethylene (TCNE) [33]. All of these complexes have one or more
distinct charge transfer transitions involving the excitation of an electron from an
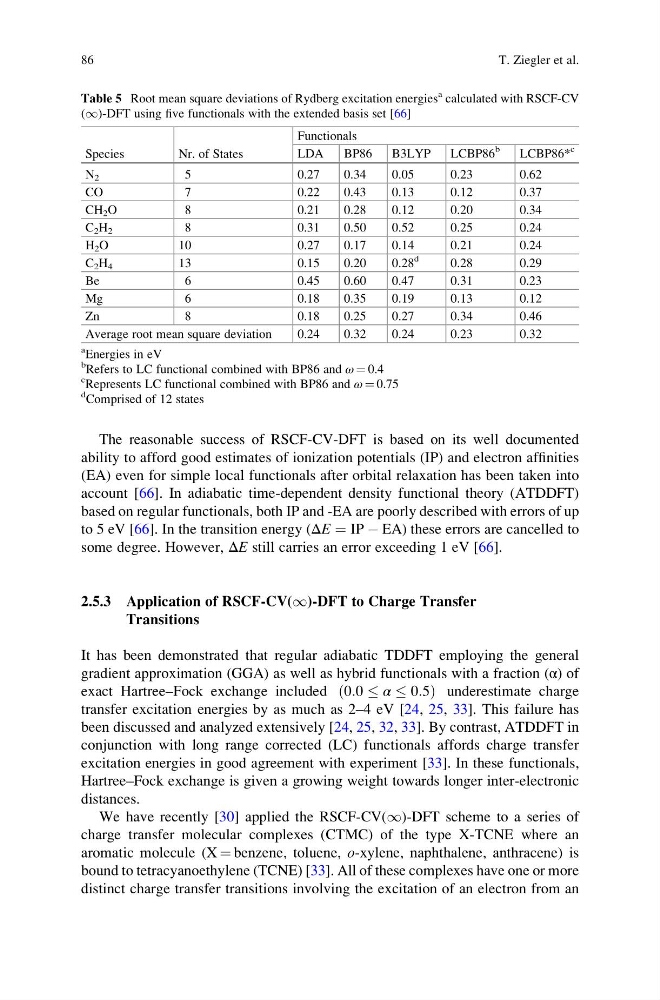
Table 5 Root mean square deviations of Rydberg excitation energies
a calculated with RSCF-CV
(1)-DFT using five functionals with the extended basis set [66]
Species
Nr. of States
Functionals
LDA
BP86
B3LYP
LCBP86
b
LCBP86*
c
N 2
5
0.27
0.34
0.05
0.23
0.62
CO
7
0.22
0.43
0.13
0.12
0.37
CH 2 O
8
0.21
0.28
0.12
0.20
0.34
C 2 H 2
8
0.31
0.50
0.52
0.25
0.24
H 2 O
10
0.27
0.17
0.14
0.21
0.24
C 2 H 4
13
0.15
0.20
0.28
d
0.28
0.29
Be
6
0.45
0.60
0.47
0.31
0.23
Mg
6
0.18
0.35
0.19
0.13
0.12
Zn
8
0.18
0.25
0.27
0.34
0.46
Average root mean square deviation
0.24
0.32
0.24
0.23
0.32
a
Energies in eV
b
Refers to LC functional combined with BP86 and ω ¼ 0.4
c
Represents LC functional combined with BP86 and ω ¼ 0.75
d
Comprised of 12 states
86
T. Ziegler et al.
ability to afford good estimates of ionization potentials (IP) and electron affinities
(EA) even for simple local functionals after orbital relaxation has been taken into
account [66]. In adiabatic time-dependent density functional theory (ATDDFT)
based on regular functionals, both IP and -EA are poorly described with errors of up
to 5 eV [66]. In the transition energy (ΔE ¼ IP À EA) these errors are cancelled to
some degree. However, ΔE still carries an error exceeding 1 eV [66].
2.5.3 Application of RSCF-CV(1)-DFT to Charge Transfer
Transitions
It has been demonstrated that regular adiabatic TDDFT employing the general
gradient approximation (GGA) as well as hybrid functionals with a fraction (α) of
exact Hartree–Fock exchange included 0:0 α 0:5
ð
Þ underestimate charge
transfer excitation energies by as much as 2–4 eV [24, 25, 33]. This failure has
been discussed and analyzed extensively [24, 25, 32, 33]. By contrast, ATDDFT in
conjunction with long range corrected (LC) functionals affords charge transfer
excitation energies in good agreement with experiment [33]. In these functionals,
Hartree–Fock exchange is given a growing weight towards longer inter-electronic
distances.
We have recently [30] applied the RSCF-CV(1)-DFT scheme to a series of
charge transfer molecular complexes (CTMC) of the type X-TCNE where an
aromatic molecule (X ¼ benzene, toluene, o-xylene, naphthalene, anthracene) is
bound to tetracyanoethylene (TCNE) [33]. All of these complexes have one or more
distinct charge transfer transitions involving the excitation of an electron from an
Table 5 Root mean square deviations of Rydberg excitation energies
a calculated with RSCF-CV
(1)-DFT using five functionals with the extended basis set [66]
Species
Nr. of States
Functionals
LDA
BP86
B3LYP
LCBP86
b
LCBP86*
c
N 2
5
0.27
0.34
0.05
0.23
0.62
CO
7
0.22
0.43
0.13
0.12
0.37
CH 2 O
8
0.21
0.28
0.12
0.20
0.34
C 2 H 2
8
0.31
0.50
0.52
0.25
0.24
H 2 O
10
0.27
0.17
0.14
0.21
0.24
C 2 H 4
13
0.15
0.20
0.28
d
0.28
0.29
Be
6
0.45
0.60
0.47
0.31
0.23
Mg
6
0.18
0.35
0.19
0.13
0.12
Zn
8
0.18
0.25
0.27
0.34
0.46
Average root mean square deviation
0.24
0.32
0.24
0.23
0.32
a
Energies in eV
b
Refers to LC functional combined with BP86 and ω ¼ 0.4
c
Represents LC functional combined with BP86 and ω ¼ 0.75
d
Comprised of 12 states
86
T. Ziegler et al.