

The ordering of the calculated CV(2)-TD (TDDFT-TD) excitation energies
based on LDA(VWN) is correct for naphthalene as well as for all other linear
acenes, although the gap differs from the experimental ΔE by almost 0.4 eV for
naphthalene, anthracene, and hexacene. This difference is smaller for naphthacene
and pentacene (Fig. 3b). It can be seen that the main contribution to this deviation
comes from the underestimation of ΔE(
1 B 2u ) Thus, the root mean square deviation
(RMSD) value for ΔE(
1 B 2u ) is 0.49 eV, while it is only 0.13 eV for ΔE(
1 B 3u ); see
Table 2.
As for the TDDFT results based on LDA(VWN), the deviation from the experimental gaps is larger in absolute terms and the calculated ΔE has the wrong sign
for naphthalene (Fig. 3c). It happens because the ΔE(
1 B 2u ) values for TDDFT are
lower than those for CV(2)-TD while the ΔE(
1 B 3u ) estimates for TDDFT are higher
than for CV(2)-TD. As a result, the RMSD value for ΔE(
1 B 2u ) increases for
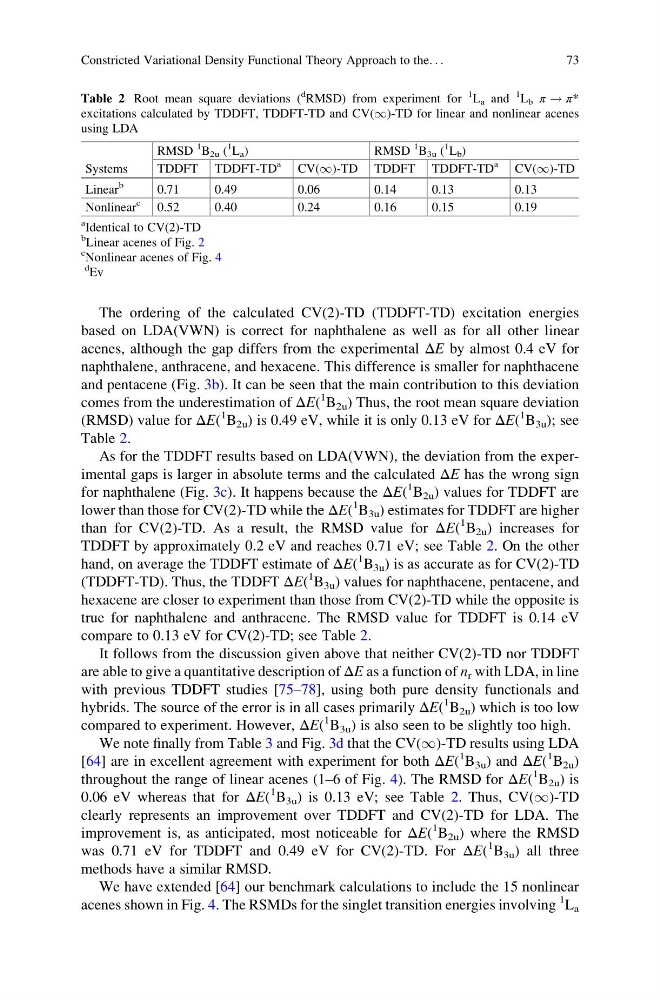
TDDFT by approximately 0.2 eV and reaches 0.71 eV; see Table 2. On the other
hand, on average the TDDFT estimate of ΔE(
1 B 3u ) is as accurate as for CV(2)-TD
(TDDFT-TD). Thus, the TDDFT ΔE(
1 B 3u ) values for naphthacene, pentacene, and
hexacene are closer to experiment than those from CV(2)-TD while the opposite is
true for naphthalene and anthracene. The RMSD value for TDDFT is 0.14 eV
compare to 0.13 eV for CV(2)-TD; see Table 2.
It follows from the discussion given above that neither CV(2)-TD nor TDDFT
are able to give a quantitative description of ΔE as a function of n r with LDA, in line
with previous TDDFT studies [75–78], using both pure density functionals and
hybrids. The source of the error is in all cases primarily ΔE(
1 B 2u ) which is too low
compared to experiment. However, ΔE(
1 B 3u ) is also seen to be slightly too high.
We note finally from Table 3 and Fig. 3d that the CV(1)-TD results using LDA
[64] are in excellent agreement with experiment for both ΔE(
1 B 3u ) and ΔE(
1 B 2u )
throughout the range of linear acenes (1–6 of Fig. 4). The RMSD for ΔE(
1 B 2u ) is
0.06 eV whereas that for ΔE(
1 B 3u ) is 0.13 eV; see Table 2. Thus, CV(1)-TD
clearly represents an improvement over TDDFT and CV(2)-TD for LDA. The
improvement is, as anticipated, most noticeable for ΔE(
1 B 2u ) where the RMSD
was 0.71 eV for TDDFT and 0.49 eV for CV(2)-TD. For ΔE(
1 B 3u ) all three
methods have a similar RMSD.
We have extended [64] our benchmark calculations to include the 15 nonlinear
acenes shown in Fig. 4. The RSMDs for the singlet transition energies involving
1 L a
Table 2 Root mean square deviations (
d
RMSD) from experiment for
1
L a and
1
L b π ! π*
excitations calculated by TDDFT, TDDFT-TD and CV(1)-TD for linear and nonlinear acenes
using LDA
Systems
RMSD
1
B 2u (
1
L a )
RMSD
1
B 3u (
1
L b )
TDDFT TDDFT-TD
a
CV(1)-TD TDDFT TDDFT-TD
a
CV(1)-TD
Linear
b
0.71
0.49
0.06
0.14
0.13
0.13
Nonlinear
c
0.52
0.40
0.24
0.16
0.15
0.19
a
Identical to CV(2)-TD
b
Linear acenes of Fig. 2
c
Nonlinear acenes of Fig. 4
d
Ev
Constricted Variational Density Functional Theory Approach to the. . .
73
based on LDA(VWN) is correct for naphthalene as well as for all other linear
acenes, although the gap differs from the experimental ΔE by almost 0.4 eV for
naphthalene, anthracene, and hexacene. This difference is smaller for naphthacene
and pentacene (Fig. 3b). It can be seen that the main contribution to this deviation
comes from the underestimation of ΔE(
1 B 2u ) Thus, the root mean square deviation
(RMSD) value for ΔE(
1 B 2u ) is 0.49 eV, while it is only 0.13 eV for ΔE(
1 B 3u ); see
Table 2.
As for the TDDFT results based on LDA(VWN), the deviation from the experimental gaps is larger in absolute terms and the calculated ΔE has the wrong sign
for naphthalene (Fig. 3c). It happens because the ΔE(
1 B 2u ) values for TDDFT are
lower than those for CV(2)-TD while the ΔE(
1 B 3u ) estimates for TDDFT are higher
than for CV(2)-TD. As a result, the RMSD value for ΔE(
1 B 2u ) increases for
TDDFT by approximately 0.2 eV and reaches 0.71 eV; see Table 2. On the other
hand, on average the TDDFT estimate of ΔE(
1 B 3u ) is as accurate as for CV(2)-TD
(TDDFT-TD). Thus, the TDDFT ΔE(
1 B 3u ) values for naphthacene, pentacene, and
hexacene are closer to experiment than those from CV(2)-TD while the opposite is
true for naphthalene and anthracene. The RMSD value for TDDFT is 0.14 eV
compare to 0.13 eV for CV(2)-TD; see Table 2.
It follows from the discussion given above that neither CV(2)-TD nor TDDFT
are able to give a quantitative description of ΔE as a function of n r with LDA, in line
with previous TDDFT studies [75–78], using both pure density functionals and
hybrids. The source of the error is in all cases primarily ΔE(
1 B 2u ) which is too low
compared to experiment. However, ΔE(
1 B 3u ) is also seen to be slightly too high.
We note finally from Table 3 and Fig. 3d that the CV(1)-TD results using LDA
[64] are in excellent agreement with experiment for both ΔE(
1 B 3u ) and ΔE(
1 B 2u )
throughout the range of linear acenes (1–6 of Fig. 4). The RMSD for ΔE(
1 B 2u ) is
0.06 eV whereas that for ΔE(
1 B 3u ) is 0.13 eV; see Table 2. Thus, CV(1)-TD
clearly represents an improvement over TDDFT and CV(2)-TD for LDA. The
improvement is, as anticipated, most noticeable for ΔE(
1 B 2u ) where the RMSD
was 0.71 eV for TDDFT and 0.49 eV for CV(2)-TD. For ΔE(
1 B 3u ) all three
methods have a similar RMSD.
We have extended [64] our benchmark calculations to include the 15 nonlinear
acenes shown in Fig. 4. The RSMDs for the singlet transition energies involving
1 L a
Table 2 Root mean square deviations (
d
RMSD) from experiment for
1
L a and
1
L b π ! π*
excitations calculated by TDDFT, TDDFT-TD and CV(1)-TD for linear and nonlinear acenes
using LDA
Systems
RMSD
1
B 2u (
1
L a )
RMSD
1
B 3u (
1
L b )
TDDFT TDDFT-TD
a
CV(1)-TD TDDFT TDDFT-TD
a
CV(1)-TD
Linear
b
0.71
0.49
0.06
0.14
0.13
0.13
Nonlinear
c
0.52
0.40
0.24
0.16
0.15
0.19
a
Identical to CV(2)-TD
b
Linear acenes of Fig. 2
c
Nonlinear acenes of Fig. 4
d
Ev
Constricted Variational Density Functional Theory Approach to the. . .
73