

most widely treated case of organic solvents, such an environment can involve a
biomolecule [145–148], a cage [149, 150] a metal [151–153], an inorganic solid
[154–156], or a molecular crystal [157] to cite a few examples. Depending on the
exact nature of the environment, one needs to set up a specific computational
protocol, but the general idea is to split the total system into two parts: the
chromophore where the electronic excitation takes place and which is treated
with TD-DFT whereas the surroundings are modeled with a simpler theoretical
model, typically Molecular Mechanics (MM). We illustrate here such a procedure
for an organic cage and redirect interested readers to a previous review on the topic
for other examples and references [27]. The selected system consists of a squaraine
dye encapsulated in a tetralactam macrocycle (see Fig. 10). Such an assembly was
experimentally investigated by Smith and coworkers [158] and later modeled
[149]. The macrocyclic cage aims to protect the dye from (bio-)chemical degradations and was not designed to tune the observed color. Indeed, the hallmark
absorption band of the dye is shifted after complexation by À0.06 eV only [158],
a bathochromic effect which can be almost perfectly reproduced by TD-DFT
calculations considering the full system quantum mechanically (À0.07 eV). However, such a brute force approach implies a large computational cost. As the
excitation is clearly localized on the squaraine, using a hybrid TD-DFT/MM is
justified. The first approach proposed in [149] was to account self-consistently for
the ground-state polarization by determining atomic point charges of the cage
equilibrated with the density of the dye. Such a procedure yields a qualitatively
incorrect hypsochromic shift of +0.10 eV. In a second approach, the response of the
cage density to the change of electronic state of the dye was modeled through a
0
20
40
60
80
100
-0.20
-0.15
-0.10
-0.05
0.00
Enol emission ratio (%)
Relative free energies (eV)
DUAL
ESIPT
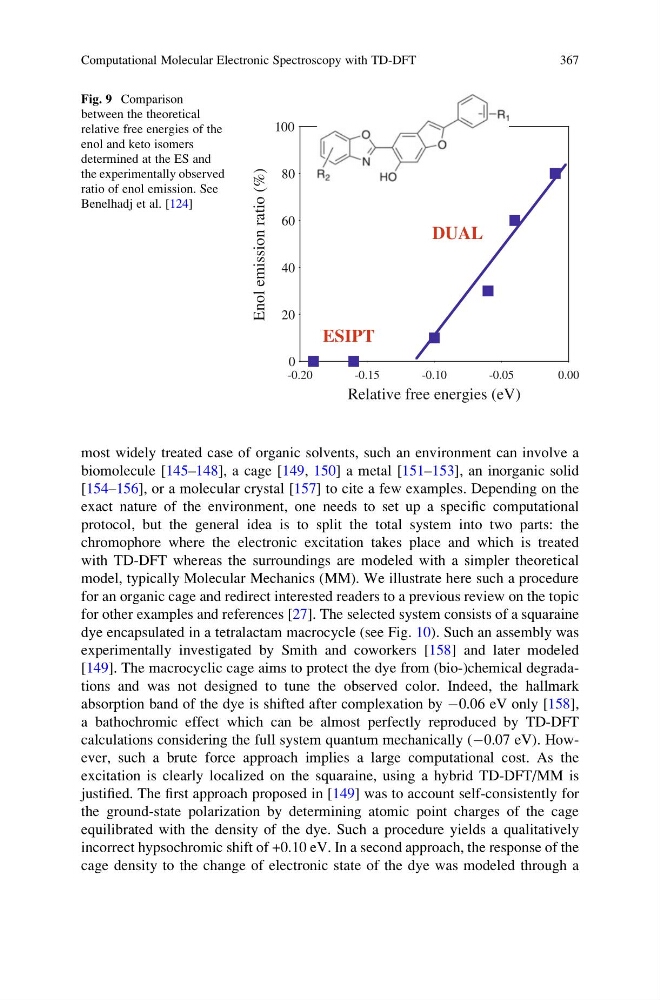
Fig. 9 Comparison
between the theoretical
relative free energies of the
enol and keto isomers
determined at the ES and
the experimentally observed
ratio of enol emission. See
Benelhadj et al. [124]
Computational Molecular Electronic Spectroscopy with TD-DFT
367
biomolecule [145–148], a cage [149, 150] a metal [151–153], an inorganic solid
[154–156], or a molecular crystal [157] to cite a few examples. Depending on the
exact nature of the environment, one needs to set up a specific computational
protocol, but the general idea is to split the total system into two parts: the
chromophore where the electronic excitation takes place and which is treated
with TD-DFT whereas the surroundings are modeled with a simpler theoretical
model, typically Molecular Mechanics (MM). We illustrate here such a procedure
for an organic cage and redirect interested readers to a previous review on the topic
for other examples and references [27]. The selected system consists of a squaraine
dye encapsulated in a tetralactam macrocycle (see Fig. 10). Such an assembly was
experimentally investigated by Smith and coworkers [158] and later modeled
[149]. The macrocyclic cage aims to protect the dye from (bio-)chemical degradations and was not designed to tune the observed color. Indeed, the hallmark
absorption band of the dye is shifted after complexation by À0.06 eV only [158],
a bathochromic effect which can be almost perfectly reproduced by TD-DFT
calculations considering the full system quantum mechanically (À0.07 eV). However, such a brute force approach implies a large computational cost. As the
excitation is clearly localized on the squaraine, using a hybrid TD-DFT/MM is
justified. The first approach proposed in [149] was to account self-consistently for
the ground-state polarization by determining atomic point charges of the cage
equilibrated with the density of the dye. Such a procedure yields a qualitatively
incorrect hypsochromic shift of +0.10 eV. In a second approach, the response of the
cage density to the change of electronic state of the dye was modeled through a
0
20
40
60
80
100
-0.20
-0.15
-0.10
-0.05
0.00
Enol emission ratio (%)
Relative free energies (eV)
DUAL
ESIPT
Fig. 9 Comparison
between the theoretical
relative free energies of the
enol and keto isomers
determined at the ES and
the experimentally observed
ratio of enol emission. See
Benelhadj et al. [124]
Computational Molecular Electronic Spectroscopy with TD-DFT
367