

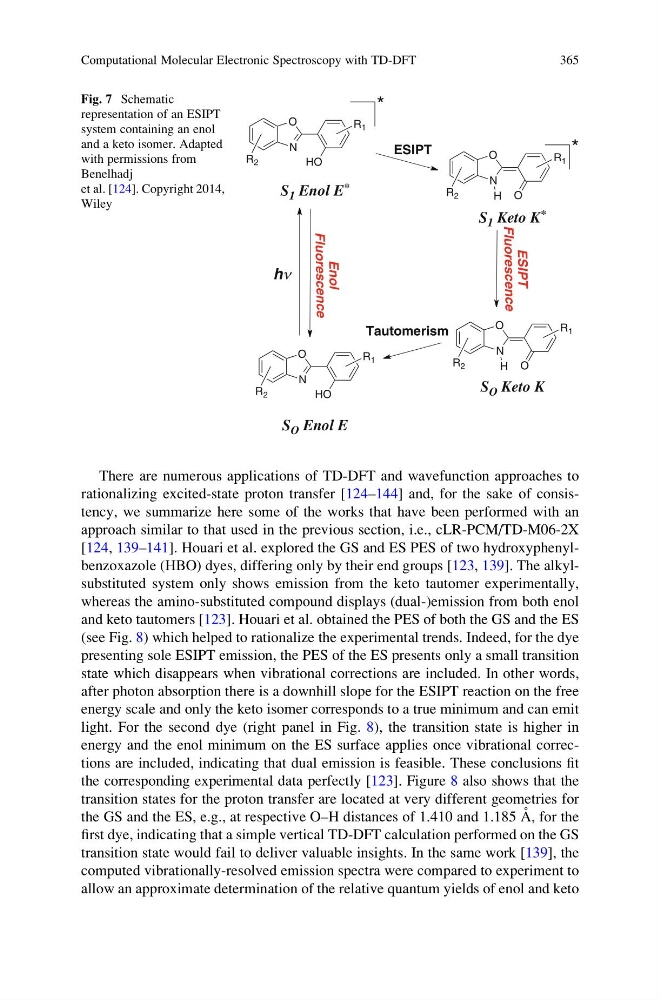
There are numerous applications of TD-DFT and wavefunction approaches to
rationalizing excited-state proton transfer [124–144] and, for the sake of consistency, we summarize here some of the works that have been performed with an
approach similar to that used in the previous section, i.e., cLR-PCM/TD-M06-2X
[124, 139–141]. Houari et al. explored the GS and ES PES of two hydroxyphenylbenzoxazole (HBO) dyes, differing only by their end groups [123, 139]. The alkylsubstituted system only shows emission from the keto tautomer experimentally,
whereas the amino-substituted compound displays (dual-)emission from both enol
and keto tautomers [123]. Houari et al. obtained the PES of both the GS and the ES
(see Fig. 8) which helped to rationalize the experimental trends. Indeed, for the dye
presenting sole ESIPT emission, the PES of the ES presents only a small transition
state which disappears when vibrational corrections are included. In other words,
after photon absorption there is a downhill slope for the ESIPT reaction on the free
energy scale and only the keto isomer corresponds to a true minimum and can emit
light. For the second dye (right panel in Fig. 8), the transition state is higher in
energy and the enol minimum on the ES surface applies once vibrational corrections are included, indicating that dual emission is feasible. These conclusions fit
the corresponding experimental data perfectly [123]. Figure 8 also shows that the
transition states for the proton transfer are located at very different geometries for
the GS and the ES, e.g., at respective O–H distances of 1.410 and 1.185 A ˚ , for the
first dye, indicating that a simple vertical TD-DFT calculation performed on the GS
transition state would fail to deliver valuable insights. In the same work [139], the
computed vibrationally-resolved emission spectra were compared to experiment to
allow an approximate determination of the relative quantum yields of enol and keto
N
O
O
R 1
R 2
S O Enol E
h
N
O
HO
R 1
R 2
S 1 Enol E *
*
S O Keto K
ESIPT
Fluorescence
N
O
HO
R 1
R 2
S 1 Keto K *
*
H
N
O
O
R 1
R 2
H
ESIPT
Tautomerism
Enol
Fluorescence
Fig. 7 Schematic
representation of an ESIPT
system containing an enol
and a keto isomer. Adapted
with permissions from
Benelhadj
et al. [124]. Copyright 2014,
Wiley
Computational Molecular Electronic Spectroscopy with TD-DFT
365
rationalizing excited-state proton transfer [124–144] and, for the sake of consistency, we summarize here some of the works that have been performed with an
approach similar to that used in the previous section, i.e., cLR-PCM/TD-M06-2X
[124, 139–141]. Houari et al. explored the GS and ES PES of two hydroxyphenylbenzoxazole (HBO) dyes, differing only by their end groups [123, 139]. The alkylsubstituted system only shows emission from the keto tautomer experimentally,
whereas the amino-substituted compound displays (dual-)emission from both enol
and keto tautomers [123]. Houari et al. obtained the PES of both the GS and the ES
(see Fig. 8) which helped to rationalize the experimental trends. Indeed, for the dye
presenting sole ESIPT emission, the PES of the ES presents only a small transition
state which disappears when vibrational corrections are included. In other words,
after photon absorption there is a downhill slope for the ESIPT reaction on the free
energy scale and only the keto isomer corresponds to a true minimum and can emit
light. For the second dye (right panel in Fig. 8), the transition state is higher in
energy and the enol minimum on the ES surface applies once vibrational corrections are included, indicating that dual emission is feasible. These conclusions fit
the corresponding experimental data perfectly [123]. Figure 8 also shows that the
transition states for the proton transfer are located at very different geometries for
the GS and the ES, e.g., at respective O–H distances of 1.410 and 1.185 A ˚ , for the
first dye, indicating that a simple vertical TD-DFT calculation performed on the GS
transition state would fail to deliver valuable insights. In the same work [139], the
computed vibrationally-resolved emission spectra were compared to experiment to
allow an approximate determination of the relative quantum yields of enol and keto
N
O
O
R 1
R 2
S O Enol E
h
N
O
HO
R 1
R 2
S 1 Enol E *
*
S O Keto K
ESIPT
Fluorescence
N
O
HO
R 1
R 2
S 1 Keto K *
*
H
N
O
O
R 1
R 2
H
ESIPT
Tautomerism
Enol
Fluorescence
Fig. 7 Schematic
representation of an ESIPT
system containing an enol
and a keto isomer. Adapted
with permissions from
Benelhadj
et al. [124]. Copyright 2014,
Wiley
Computational Molecular Electronic Spectroscopy with TD-DFT
365