

4.2 Inorganic Dyes
Although to date most applications of TD-DFT vibronic calculations have been
performed for organic structures, there have also been several simulations for
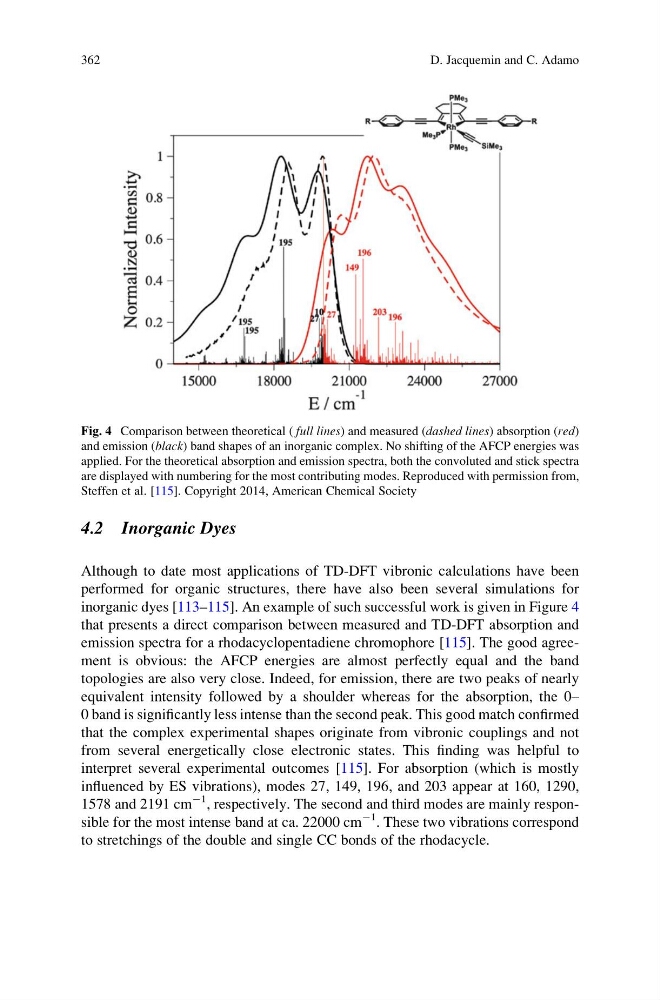
inorganic dyes [113–115]. An example of such successful work is given in Figure 4
that presents a direct comparison between measured and TD-DFT absorption and
emission spectra for a rhodacyclopentadiene chromophore [115]. The good agreement is obvious: the AFCP energies are almost perfectly equal and the band
topologies are also very close. Indeed, for emission, there are two peaks of nearly
equivalent intensity followed by a shoulder whereas for the absorption, the 0–
0 band is significantly less intense than the second peak. This good match confirmed
that the complex experimental shapes originate from vibronic couplings and not
from several energetically close electronic states. This finding was helpful to
interpret several experimental outcomes [115]. For absorption (which is mostly
influenced by ES vibrations), modes 27, 149, 196, and 203 appear at 160, 1290,
1578 and 2191 cm
À1 , respectively. The second and third modes are mainly responsible for the most intense band at ca. 22000 cm
À1
. These two vibrations correspond
to stretchings of the double and single CC bonds of the rhodacycle.
Fig. 4 Comparison between theoretical ( full lines) and measured (dashed lines) absorption (red)
and emission (black) band shapes of an inorganic complex. No shifting of the AFCP energies was
applied. For the theoretical absorption and emission spectra, both the convoluted and stick spectra
are displayed with numbering for the most contributing modes. Reproduced with permission from,
Steffen et al. [115]. Copyright 2014, American Chemical Society
362
D. Jacquemin and C. Adamo
Although to date most applications of TD-DFT vibronic calculations have been
performed for organic structures, there have also been several simulations for
inorganic dyes [113–115]. An example of such successful work is given in Figure 4
that presents a direct comparison between measured and TD-DFT absorption and
emission spectra for a rhodacyclopentadiene chromophore [115]. The good agreement is obvious: the AFCP energies are almost perfectly equal and the band
topologies are also very close. Indeed, for emission, there are two peaks of nearly
equivalent intensity followed by a shoulder whereas for the absorption, the 0–
0 band is significantly less intense than the second peak. This good match confirmed
that the complex experimental shapes originate from vibronic couplings and not
from several energetically close electronic states. This finding was helpful to
interpret several experimental outcomes [115]. For absorption (which is mostly
influenced by ES vibrations), modes 27, 149, 196, and 203 appear at 160, 1290,
1578 and 2191 cm
À1 , respectively. The second and third modes are mainly responsible for the most intense band at ca. 22000 cm
À1
. These two vibrations correspond
to stretchings of the double and single CC bonds of the rhodacycle.
Fig. 4 Comparison between theoretical ( full lines) and measured (dashed lines) absorption (red)
and emission (black) band shapes of an inorganic complex. No shifting of the AFCP energies was
applied. For the theoretical absorption and emission spectra, both the convoluted and stick spectra
are displayed with numbering for the most contributing modes. Reproduced with permission from,
Steffen et al. [115]. Copyright 2014, American Chemical Society
362
D. Jacquemin and C. Adamo