

4 Illustrations
4.1 Organic Electronic Chromophores
As stated previously, one of the advantages of computing vibrationally-resolved
spectra is the access to both band topologies and absolute intensities, both data
being unreachable with vertical calculations. We recently illustrated these aspects
for a series of small organic chromophores used in organic electronics [111]. For
three compounds proposed by Ba ¨uerle and collaborators, a dramatic effect of the
end groups was noted experimentally [112]. Indeed, adding terminal electroaccepting groups induces strong variations of the position, intensity, and shape of
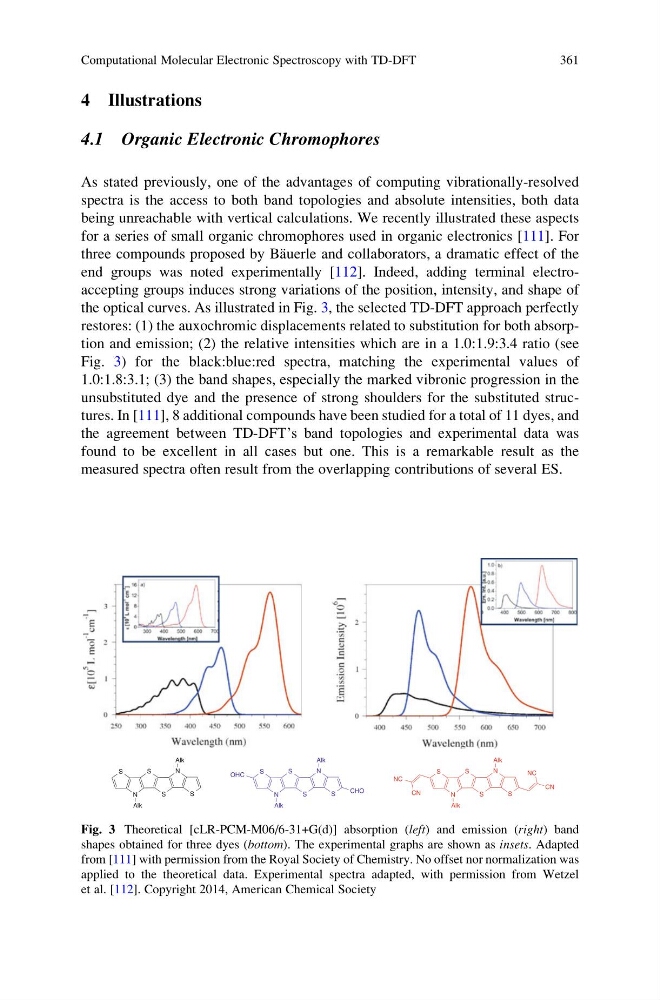
the optical curves. As illustrated in Fig. 3, the selected TD-DFT approach perfectly
restores: (1) the auxochromic displacements related to substitution for both absorption and emission; (2) the relative intensities which are in a 1.0:1.9:3.4 ratio (see
Fig. 3) for the black:blue:red spectra, matching the experimental values of
1.0:1.8:3.1; (3) the band shapes, especially the marked vibronic progression in the
unsubstituted dye and the presence of strong shoulders for the substituted structures. In [111], 8 additional compounds have been studied for a total of 11 dyes, and
the agreement between TD-DFT’s band topologies and experimental data was
found to be excellent in all cases but one. This is a remarkable result as the
measured spectra often result from the overlapping contributions of several ES.
S
N
S
S
N
Alk
Alk
S
S
N
S
S
N
Alk
Alk
S
OHC
CHO
S
N
S
S
N
Alk
Alk
S
CN
NC
CN
NC
Fig. 3 Theoretical [cLR-PCM-M06/6-31+G(d)] absorption (left) and emission (right) band
shapes obtained for three dyes (bottom). The experimental graphs are shown as insets. Adapted
from [111] with permission from the Royal Society of Chemistry. No offset nor normalization was
applied to the theoretical data. Experimental spectra adapted, with permission from Wetzel
et al. [112]. Copyright 2014, American Chemical Society
Computational Molecular Electronic Spectroscopy with TD-DFT
361
4.1 Organic Electronic Chromophores
As stated previously, one of the advantages of computing vibrationally-resolved
spectra is the access to both band topologies and absolute intensities, both data
being unreachable with vertical calculations. We recently illustrated these aspects
for a series of small organic chromophores used in organic electronics [111]. For
three compounds proposed by Ba ¨uerle and collaborators, a dramatic effect of the
end groups was noted experimentally [112]. Indeed, adding terminal electroaccepting groups induces strong variations of the position, intensity, and shape of
the optical curves. As illustrated in Fig. 3, the selected TD-DFT approach perfectly
restores: (1) the auxochromic displacements related to substitution for both absorption and emission; (2) the relative intensities which are in a 1.0:1.9:3.4 ratio (see
Fig. 3) for the black:blue:red spectra, matching the experimental values of
1.0:1.8:3.1; (3) the band shapes, especially the marked vibronic progression in the
unsubstituted dye and the presence of strong shoulders for the substituted structures. In [111], 8 additional compounds have been studied for a total of 11 dyes, and
the agreement between TD-DFT’s band topologies and experimental data was
found to be excellent in all cases but one. This is a remarkable result as the
measured spectra often result from the overlapping contributions of several ES.
S
N
S
S
N
Alk
Alk
S
S
N
S
S
N
Alk
Alk
S
OHC
CHO
S
N
S
S
N
Alk
Alk
S
CN
NC
CN
NC
Fig. 3 Theoretical [cLR-PCM-M06/6-31+G(d)] absorption (left) and emission (right) band
shapes obtained for three dyes (bottom). The experimental graphs are shown as insets. Adapted
from [111] with permission from the Royal Society of Chemistry. No offset nor normalization was
applied to the theoretical data. Experimental spectra adapted, with permission from Wetzel
et al. [112]. Copyright 2014, American Chemical Society
Computational Molecular Electronic Spectroscopy with TD-DFT
361