

E t
ð Þ ¼
X
p¼1, 2, 3, 4
~
ℰ t À τ p
À
Á
e
ik p ÁrÀiω p tÀ τ p
ð Þþiϕ p þ c:c:
ð9Þ
where ϕ p is the phase of the pth pulse, τ p , ω p the central times and frequencies of the
temporal and spectral pulse envelopes and ~
ℰ p t
ð Þ the temporal pulse envelopes
centered at t ¼ 0. The system interacts once with each pulse and the signal can then
be plotted as a function of the pulse parameters. The terms in the perturbative
expansions are conveniently depicted diagrammatically. Besides facilitating
enumeration of all terms, this procedure allows one to write quickly the signal
corresponding to a particular diagram and to discern in which time periods particular coherences appear. For macroscopic samples longer than the relevant radiation wavelength a delta function δ(Àk 4 Æ k 3 Æ k 2 Æ k 1 ) results. This is known as
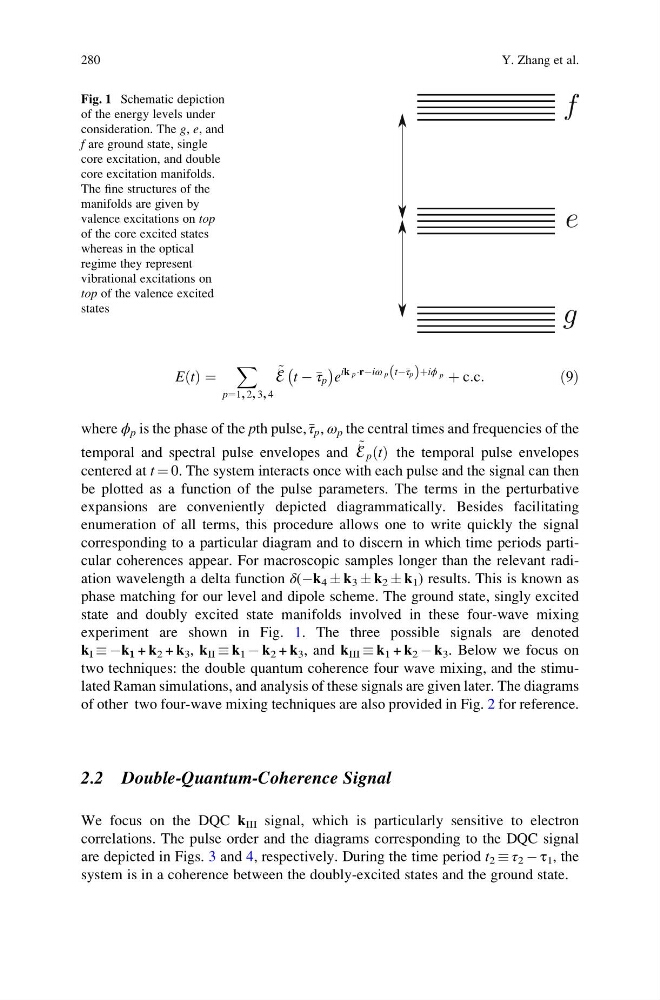
phase matching for our level and dipole scheme. The ground state, singly excited
state and doubly excited state manifolds involved in these four-wave mixing
experiment are shown in Fig. 1. The three possible signals are denoted
k I Àk 1 + k 2 + k 3 , k II k 1 À k 2 + k 3 , and k III k 1 + k 2 À k 3 . Below we focus on
two techniques: the double quantum coherence four wave mixing, and the stimulated Raman simulations, and analysis of these signals are given later. The diagrams
of other two four-wave mixing techniques are also provided in Fig. 2 for reference.
2.2 Double-Quantum-Coherence Signal
We focus on the DQC k III signal, which is particularly sensitive to electron
correlations. The pulse order and the diagrams corresponding to the DQC signal
are depicted in Figs. 3 and 4, respectively. During the time period t 2 τ 2 À τ 1 , the
system is in a coherence between the doubly-excited states and the ground state.
Fig. 1 Schematic depiction
of the energy levels under
consideration. The g, e, and
f are ground state, single
core excitation, and double
core excitation manifolds.
The fine structures of the
manifolds are given by
valence excitations on top
of the core excited states
whereas in the optical
regime they represent
vibrational excitations on
top of the valence excited
states
280
Y. Zhang et al.
ð Þ ¼
X
p¼1, 2, 3, 4
~
ℰ t À τ p
À
Á
e
ik p ÁrÀiω p tÀ τ p
ð Þþiϕ p þ c:c:
ð9Þ
where ϕ p is the phase of the pth pulse, τ p , ω p the central times and frequencies of the
temporal and spectral pulse envelopes and ~
ℰ p t
ð Þ the temporal pulse envelopes
centered at t ¼ 0. The system interacts once with each pulse and the signal can then
be plotted as a function of the pulse parameters. The terms in the perturbative
expansions are conveniently depicted diagrammatically. Besides facilitating
enumeration of all terms, this procedure allows one to write quickly the signal
corresponding to a particular diagram and to discern in which time periods particular coherences appear. For macroscopic samples longer than the relevant radiation wavelength a delta function δ(Àk 4 Æ k 3 Æ k 2 Æ k 1 ) results. This is known as
phase matching for our level and dipole scheme. The ground state, singly excited
state and doubly excited state manifolds involved in these four-wave mixing
experiment are shown in Fig. 1. The three possible signals are denoted
k I Àk 1 + k 2 + k 3 , k II k 1 À k 2 + k 3 , and k III k 1 + k 2 À k 3 . Below we focus on
two techniques: the double quantum coherence four wave mixing, and the stimulated Raman simulations, and analysis of these signals are given later. The diagrams
of other two four-wave mixing techniques are also provided in Fig. 2 for reference.
2.2 Double-Quantum-Coherence Signal
We focus on the DQC k III signal, which is particularly sensitive to electron
correlations. The pulse order and the diagrams corresponding to the DQC signal
are depicted in Figs. 3 and 4, respectively. During the time period t 2 τ 2 À τ 1 , the
system is in a coherence between the doubly-excited states and the ground state.
Fig. 1 Schematic depiction
of the energy levels under
consideration. The g, e, and
f are ground state, single
core excitation, and double
core excitation manifolds.
The fine structures of the
manifolds are given by
valence excitations on top
of the core excited states
whereas in the optical
regime they represent
vibrational excitations on
top of the valence excited
states
280
Y. Zhang et al.