

4 Applications of the REKS Method to Excited States
Although the application of the SA-REKS and SI-SA-REKS methods to diatomic
molecules in Sect. 3.2 illustrates their capabilities in comparison with the (nearly)
exact calculations, a more general benchmarking of the methods is needed to
establish them as generally applicable computational schemes. In [59], the accuracy
of the SI-SA-REKS method for valence excitations in ordinary (i.e., not strongly
correlated) organic molecules was studied. For a set of 15 π ! π* and n ! π*
excitations in aliphatic and aromatic hydrocarbons, it was found that SI-SAREKS describes these excitations on a par with the widely used linear response
methods, such as TD-DFT or ADC(2) [87–91] (second-order algebraic diagrammatic construction; a method based on second-order perturbation expansion of the
linear-response polarization propagator).
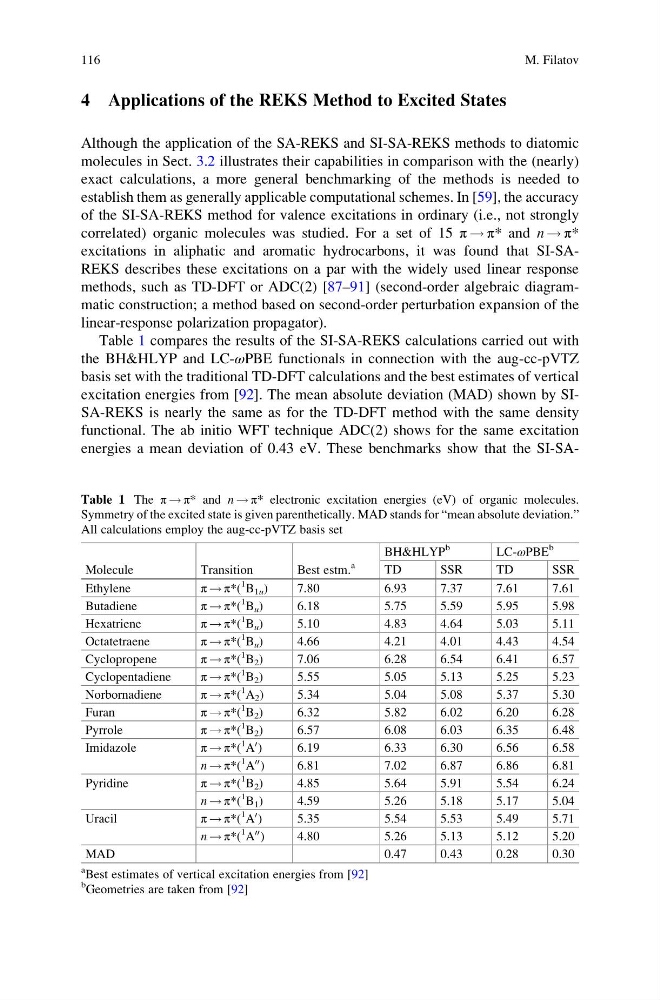
Table 1 compares the results of the SI-SA-REKS calculations carried out with
the BH&HLYP and LC-ωPBE functionals in connection with the aug-cc-pVTZ
basis set with the traditional TD-DFT calculations and the best estimates of vertical
excitation energies from [92]. The mean absolute deviation (MAD) shown by SISA-REKS is nearly the same as for the TD-DFT method with the same density
functional. The ab initio WFT technique ADC(2) shows for the same excitation
energies a mean deviation of 0.43 eV. These benchmarks show that the SI-SATable 1 The π ! π* and n ! π* electronic excitation energies (eV) of organic molecules.
Symmetry of the excited state is given parenthetically. MAD stands for “mean absolute deviation.”
All calculations employ the aug-cc-pVTZ basis set
Molecule
Transition
Best estm.
a
BH&HLYP
b
LC-ωPBE
b
TD
SSR
TD
SSR
Ethylene
π ! π*(
1
B 1u )
7.80
6.93
7.37
7.61
7.61
Butadiene
π ! π*(
1
B u )
6.18
5.75
5.59
5.95
5.98
Hexatriene
π ! π*(
1
B u )
5.10
4.83
4.64
5.03
5.11
Octatetraene
π ! π*(
1
B u )
4.66
4.21
4.01
4.43
4.54
Cyclopropene
π ! π*(
1
B 2 )
7.06
6.28
6.54
6.41
6.57
Cyclopentadiene
π ! π*(
1
B 2 )
5.55
5.05
5.13
5.25
5.23
Norbornadiene
π ! π*(
1
A 2 )
5.34
5.04
5.08
5.37
5.30
Furan
π ! π*(
1
B 2 )
6.32
5.82
6.02
6.20
6.28
Pyrrole
π ! π*(
1
B 2 )
6.57
6.08
6.03
6.35
6.48
Imidazole
π ! π*(
1
A
0 )
6.19
6.33
6.30
6.56
6.58
n ! π*(
1
A
00 )
6.81
7.02
6.87
6.86
6.81
Pyridine
π ! π*(
1
B 2 )
4.85
5.64
5.91
5.54
6.24
n ! π*(
1
B 1 )
4.59
5.26
5.18
5.17
5.04
Uracil
π ! π*(
1
A
0 )
5.35
5.54
5.53
5.49
5.71
n ! π*(
1
A
00 )
4.80
5.26
5.13
5.12
5.20
MAD
0.47
0.43
0.28
0.30
a
Best estimates of vertical excitation energies from [92]
b
Geometries are taken from [92]
116
M. Filatov
Although the application of the SA-REKS and SI-SA-REKS methods to diatomic
molecules in Sect. 3.2 illustrates their capabilities in comparison with the (nearly)
exact calculations, a more general benchmarking of the methods is needed to
establish them as generally applicable computational schemes. In [59], the accuracy
of the SI-SA-REKS method for valence excitations in ordinary (i.e., not strongly
correlated) organic molecules was studied. For a set of 15 π ! π* and n ! π*
excitations in aliphatic and aromatic hydrocarbons, it was found that SI-SAREKS describes these excitations on a par with the widely used linear response
methods, such as TD-DFT or ADC(2) [87–91] (second-order algebraic diagrammatic construction; a method based on second-order perturbation expansion of the
linear-response polarization propagator).
Table 1 compares the results of the SI-SA-REKS calculations carried out with
the BH&HLYP and LC-ωPBE functionals in connection with the aug-cc-pVTZ
basis set with the traditional TD-DFT calculations and the best estimates of vertical
excitation energies from [92]. The mean absolute deviation (MAD) shown by SISA-REKS is nearly the same as for the TD-DFT method with the same density
functional. The ab initio WFT technique ADC(2) shows for the same excitation
energies a mean deviation of 0.43 eV. These benchmarks show that the SI-SATable 1 The π ! π* and n ! π* electronic excitation energies (eV) of organic molecules.
Symmetry of the excited state is given parenthetically. MAD stands for “mean absolute deviation.”
All calculations employ the aug-cc-pVTZ basis set
Molecule
Transition
Best estm.
a
BH&HLYP
b
LC-ωPBE
b
TD
SSR
TD
SSR
Ethylene
π ! π*(
1
B 1u )
7.80
6.93
7.37
7.61
7.61
Butadiene
π ! π*(
1
B u )
6.18
5.75
5.59
5.95
5.98
Hexatriene
π ! π*(
1
B u )
5.10
4.83
4.64
5.03
5.11
Octatetraene
π ! π*(
1
B u )
4.66
4.21
4.01
4.43
4.54
Cyclopropene
π ! π*(
1
B 2 )
7.06
6.28
6.54
6.41
6.57
Cyclopentadiene
π ! π*(
1
B 2 )
5.55
5.05
5.13
5.25
5.23
Norbornadiene
π ! π*(
1
A 2 )
5.34
5.04
5.08
5.37
5.30
Furan
π ! π*(
1
B 2 )
6.32
5.82
6.02
6.20
6.28
Pyrrole
π ! π*(
1
B 2 )
6.57
6.08
6.03
6.35
6.48
Imidazole
π ! π*(
1
A
0 )
6.19
6.33
6.30
6.56
6.58
n ! π*(
1
A
00 )
6.81
7.02
6.87
6.86
6.81
Pyridine
π ! π*(
1
B 2 )
4.85
5.64
5.91
5.54
6.24
n ! π*(
1
B 1 )
4.59
5.26
5.18
5.17
5.04
Uracil
π ! π*(
1
A
0 )
5.35
5.54
5.53
5.49
5.71
n ! π*(
1
A
00 )
4.80
5.26
5.13
5.12
5.20
MAD
0.47
0.43
0.28
0.30
a
Best estimates of vertical excitation energies from [92]
b
Geometries are taken from [92]
116
M. Filatov