

ωPBE functional and the aug-cc-pVTZ basis set are compared with the results of the
conventional TD-DFT calculations (with the same basis set and functional) and with
the literature data. The x
1
Σ
+
a
1
Σ
+ excitation energy of LiH was recently studied
using an ab initio restricted active space CI (RASCI) method with the aug-cc-pVTZ
basis set [86]. For the individual states, the x
1
Σ
+ and the a
1
Σ
+ states, the potential
energy curves along the dissociation path were obtained in [31] using the CCSD
method (presumably the EOM-CCSD was used to obtain the excited state curve).
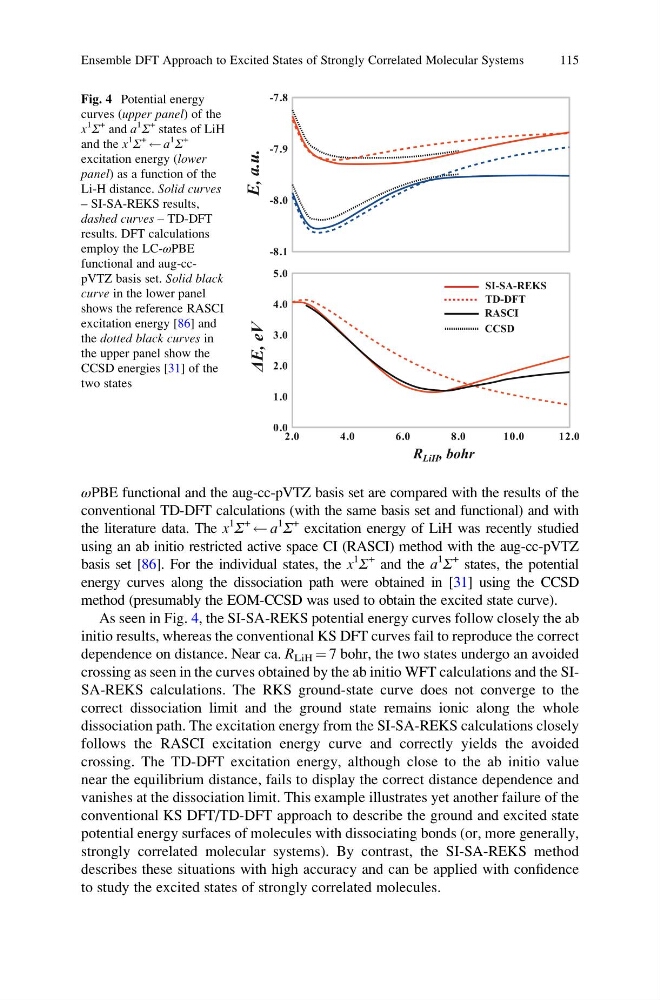
As seen in Fig. 4, the SI-SA-REKS potential energy curves follow closely the ab
initio results, whereas the conventional KS DFT curves fail to reproduce the correct
dependence on distance. Near ca. R LiH ¼ 7 bohr, the two states undergo an avoided
crossing as seen in the curves obtained by the ab initio WFT calculations and the SISA-REKS calculations. The RKS ground-state curve does not converge to the
correct dissociation limit and the ground state remains ionic along the whole
dissociation path. The excitation energy from the SI-SA-REKS calculations closely
follows the RASCI excitation energy curve and correctly yields the avoided
crossing. The TD-DFT excitation energy, although close to the ab initio value
near the equilibrium distance, fails to display the correct distance dependence and
vanishes at the dissociation limit. This example illustrates yet another failure of the
conventional KS DFT/TD-DFT approach to describe the ground and excited state
potential energy surfaces of molecules with dissociating bonds (or, more generally,
strongly correlated molecular systems). By contrast, the SI-SA-REKS method
describes these situations with high accuracy and can be applied with confidence
to study the excited states of strongly correlated molecules.
Fig. 4 Potential energy
curves (upper panel) of the
x
1
Σ
+ and a
1
Σ
+ states of LiH
and the x
1
Σ
+
a
1
Σ
+
excitation energy (lower
panel) as a function of the
Li-H distance. Solid curves
– SI-SA-REKS results,
dashed curves – TD-DFT
results. DFT calculations
employ the LC-ωPBE
functional and aug-ccpVTZ basis set. Solid black
curve in the lower panel
shows the reference RASCI
excitation energy [86] and
the dotted black curves in
the upper panel show the
CCSD energies [31] of the
two states
Ensemble DFT Approach to Excited States of Strongly Correlated Molecular Systems
115
conventional TD-DFT calculations (with the same basis set and functional) and with
the literature data. The x
1
Σ
+
a
1
Σ
+ excitation energy of LiH was recently studied
using an ab initio restricted active space CI (RASCI) method with the aug-cc-pVTZ
basis set [86]. For the individual states, the x
1
Σ
+ and the a
1
Σ
+ states, the potential
energy curves along the dissociation path were obtained in [31] using the CCSD
method (presumably the EOM-CCSD was used to obtain the excited state curve).
As seen in Fig. 4, the SI-SA-REKS potential energy curves follow closely the ab
initio results, whereas the conventional KS DFT curves fail to reproduce the correct
dependence on distance. Near ca. R LiH ¼ 7 bohr, the two states undergo an avoided
crossing as seen in the curves obtained by the ab initio WFT calculations and the SISA-REKS calculations. The RKS ground-state curve does not converge to the
correct dissociation limit and the ground state remains ionic along the whole
dissociation path. The excitation energy from the SI-SA-REKS calculations closely
follows the RASCI excitation energy curve and correctly yields the avoided
crossing. The TD-DFT excitation energy, although close to the ab initio value
near the equilibrium distance, fails to display the correct distance dependence and
vanishes at the dissociation limit. This example illustrates yet another failure of the
conventional KS DFT/TD-DFT approach to describe the ground and excited state
potential energy surfaces of molecules with dissociating bonds (or, more generally,
strongly correlated molecular systems). By contrast, the SI-SA-REKS method
describes these situations with high accuracy and can be applied with confidence
to study the excited states of strongly correlated molecules.
Fig. 4 Potential energy
curves (upper panel) of the
x
1
Σ
+ and a
1
Σ
+ states of LiH
and the x
1
Σ
+
a
1
Σ
+
excitation energy (lower
panel) as a function of the
Li-H distance. Solid curves
– SI-SA-REKS results,
dashed curves – TD-DFT
results. DFT calculations
employ the LC-ωPBE
functional and aug-ccpVTZ basis set. Solid black
curve in the lower panel
shows the reference RASCI
excitation energy [86] and
the dotted black curves in
the upper panel show the
CCSD energies [31] of the
two states
Ensemble DFT Approach to Excited States of Strongly Correlated Molecular Systems
115