

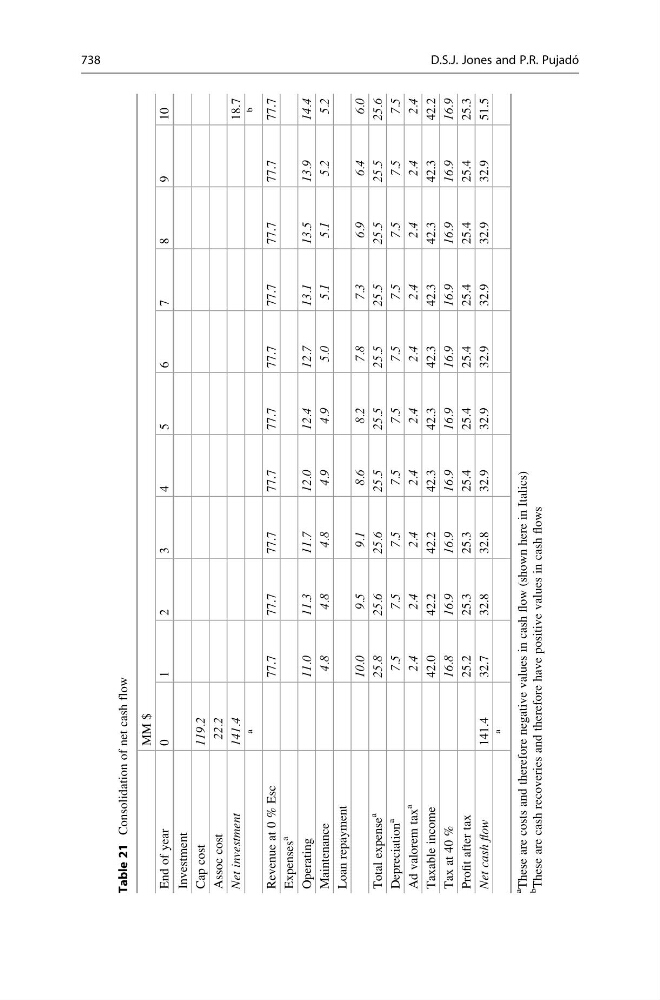
Table 21
Consolidation of net cash flow
MM $
End of year
0
1
2
3
4
5
6
7
8
9
1 0
Investment
Cap cost
119.2
Assoc cost
22.2
Net investment
141.4
18.7
a
b
Revenue at 0 % Esc
77.7
77.7
77.7
77.7
77.7
77.7
77.7
77.7
77.7
77.7
Expenses
a
Operating
11.0
11.3
11.7
12.0
12.4
12.7
13.1
13.5
13.9
14.4
Maintenance
4.8
4.8
4.8
4.9
4.9
5.0
5.1
5.1
5.2
5.2
Loan repayment
10.0
9.5
9.1
8.6
8.2
7.8
7.3
6.9
6.4
6.0
Total expense
a
25.8
25.6
25.6
25.5
25.5
25.5
25.5
25.5
25.5
25.6
Depreciation
a
7.5
7.5
7.5
7.5
7.5
7.5
7.5
7.5
7.5
7.5
Ad valorem tax
a
2.4
2.4
2.4
2.4
2.4
2.4
2.4
2.4
2.4
2.4
Taxable income
42.0
42.2
42.2
42.3
42.3
42.3
42.3
42.3
42.3
42.2
Tax at 40 %
16.8
16.9
16.9
16.9
16.9
16.9
16.9
16.9
16.9
16.9
Profit after tax
25.2
25.3
25.3
25.4
25.4
25.4
25.4
25.4
25.4
25.3
Net cash flow
141.4
32.7
32.8
32.8
32.9
32.9
32.9
32.9
32.9
32.9
51.5
a
a
These are costs and therefore negative values in cash flow (shown here in Italics)
b
These are cash recoveries and therefore have positive values in cash flows
738
D.S.J. Jones and P.R. Pujado ´