

as the original capacity factored estimate of 125.490 MM $. This allows for such
items in the associated costs such as the precious metal content of catalysts
which are subject to depreciation. For this example, therefore, depreciation is
taken as 7.7 MM $ per year throughout.
Ad Valorem Tax
This item includes plant insurance and is set at 2.0 % of capital cost per year.
Tax
This is 40 % of taxable income. For the purpose of this study, it is assumed there are
no tax credits.
Results
Consolidation of the net cash flow is given in Table 21.
Figure 10 gives a plot of the cumulative net present worth versus percent
discount from the results of the calculations given in Table 22.
From Fig. 9, the DCF return on investment for this scheme is 20.5 % per year.
Based on the plant location and the current investment environment, return on
investment above 18 % DCF makes the venture economically attractive. Similar
calculations for scheme 3 will also be conducted to verify its ROI on a DCF basis
for comparison with scheme 1.
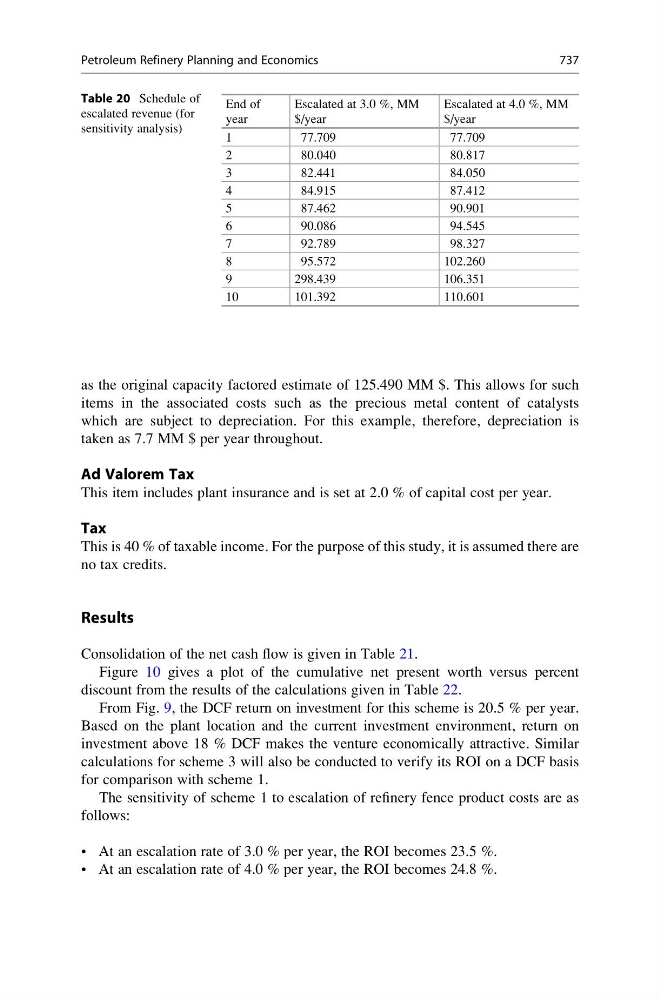
The sensitivity of scheme 1 to escalation of refinery fence product costs are as
follows:
• At an escalation rate of 3.0 % per year, the ROI becomes 23.5 %.
• At an escalation rate of 4.0 % per year, the ROI becomes 24.8 %.
Table 20 Schedule of
escalated revenue (for
sensitivity analysis)
End of
year
Escalated at 3.0 %, MM
$/year
Escalated at 4.0 %, MM
$/year
1
77.709
77.709
2
80.040
80.817
3
82.441
84.050
4
84.915
87.412
5
87.462
90.901
6
90.086
94.545
7
92.789
98.327
8
95.572
102.260
9
298.439
106.351
10
101.392
110.601
Petroleum Refinery Planning and Economics
737