

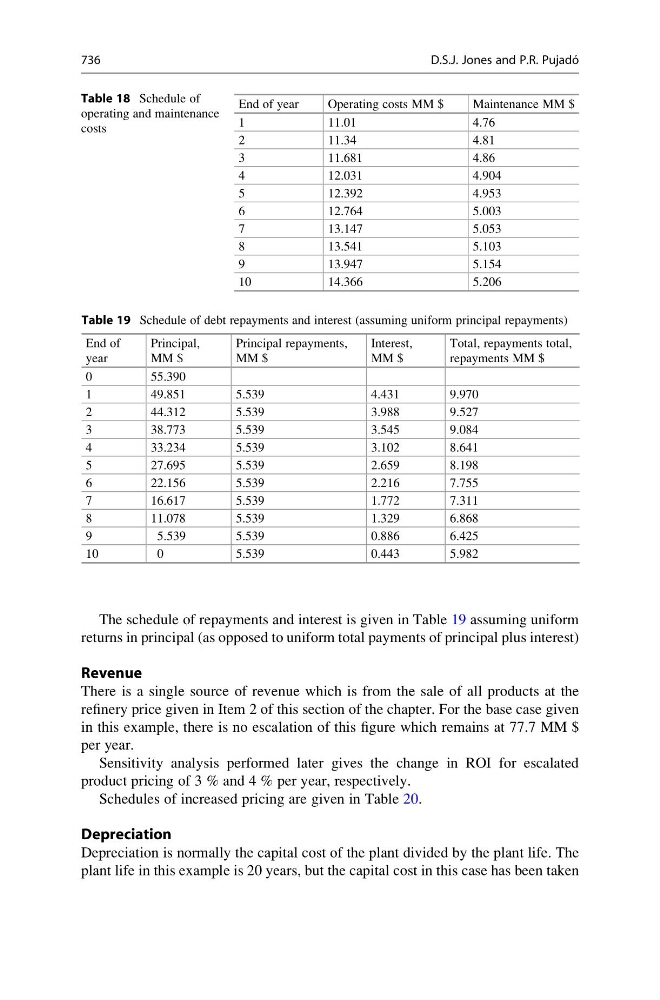
The schedule of repayments and interest is given in Table 19 assuming uniform
returns in principal (as opposed to uniform total payments of principal plus interest)
Revenue
There is a single source of revenue which is from the sale of all products at the
refinery price given in Item 2 of this section of the chapter. For the base case given
in this example, there is no escalation of this figure which remains at 77.7 MM $
per year.
Sensitivity analysis performed later gives the change in ROI for escalated
product pricing of 3 % and 4 % per year, respectively.
Schedules of increased pricing are given in Table 20.
Depreciation
Depreciation is normally the capital cost of the plant divided by the plant life. The
plant life in this example is 20 years, but the capital cost in this case has been taken
Table 18 Schedule of
operating and maintenance
costs
End of year
Operating costs MM $
Maintenance MM $
1
11.01
4.76
2
11.34
4.81
3
11.681
4.86
4
12.031
4.904
5
12.392
4.953
6
12.764
5.003
7
13.147
5.053
8
13.541
5.103
9
13.947
5.154
10
14.366
5.206
Table 19 Schedule of debt repayments and interest (assuming uniform principal repayments)
End of
year
Principal,
MM $
Principal repayments,
MM $
Interest,
MM $
Total, repayments total,
repayments MM $
0
55.390
1
49.851
5.539
4.431
9.970
2
44.312
5.539
3.988
9.527
3
38.773
5.539
3.545
9.084
4
33.234
5.539
3.102
8.641
5
27.695
5.539
2.659
8.198
6
22.156
5.539
2.216
7.755
7
16.617
5.539
1.772
7.311
8
11.078
5.539
1.329
6.868
9
5.539
5.539
0.886
6.425
10
0
5.539
0.443
5.982
736
D.S.J. Jones and P.R. Pujado ´