

K is the equilibrium constant and can be read from the curves found in textbooks
such as Maxwell’s Data Book on Hydrocarbons or can be considered (rough and
not be used for definitive design) as
K ¼ Vapor Pressure at temperature
ð
Þ =Total Pressure
(3)
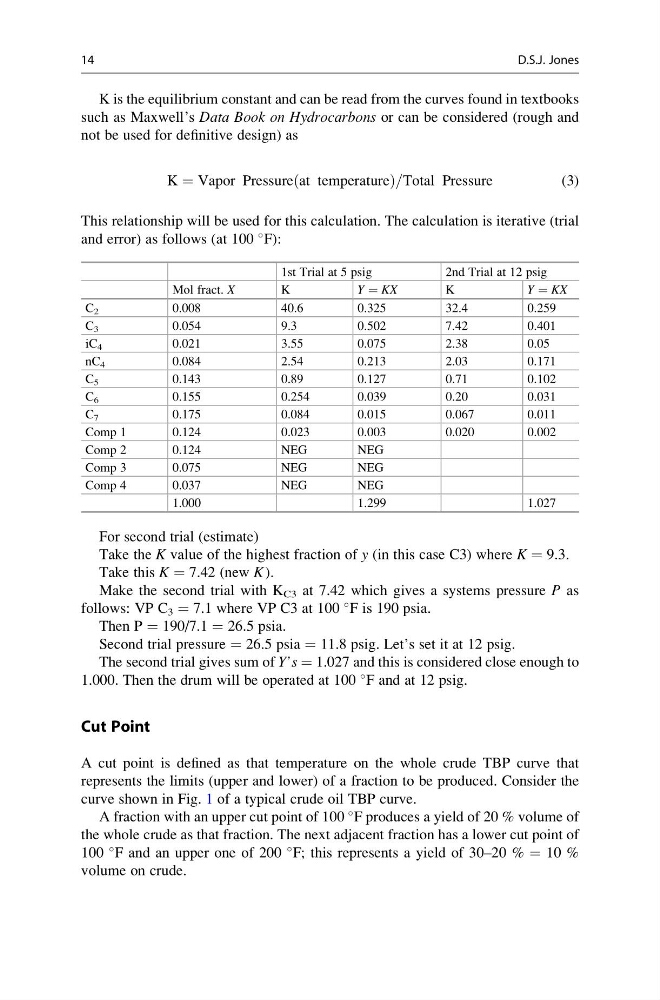
This relationship will be used for this calculation. The calculation is iterative (trial
and error) as follows (at 100
F):
1st Trial at 5 psig
2nd Trial at 12 psig
Mol fract. X
K
Y = KX
K
Y = KX
C 2
0.008
40.6
0.325
32.4
0.259
C 3
0.054
9.3
0.502
7.42
0.401
iC 4
0.021
3.55
0.075
2.38
0.05
nC 4
0.084
2.54
0.213
2.03
0.171
C 5
0.143
0.89
0.127
0.71
0.102
C 6
0.155
0.254
0.039
0.20
0.031
C 7
0.175
0.084
0.015
0.067
0.011
Comp 1
0.124
0.023
0.003
0.020
0.002
Comp 2
0.124
NEG
NEG
Comp 3
0.075
NEG
NEG
Comp 4
0.037
NEG
NEG
1.000
1.299
1.027
For second trial (estimate)
Take the K value of the highest fraction of y (in this case C3) where K = 9.3.
Take this K = 7.42 (new K ).
Make the second trial with K C3 at 7.42 which gives a systems pressure P as
follows: VP C 3 = 7.1 where VP C3 at 100
F is 190 psia.
Then P = 190/7.1 = 26.5 psia.
Second trial pressure = 26.5 psia = 11.8 psig. Let’s set it at 12 psig.
The second trial gives sum of Y’s = 1.027 and this is considered close enough to
1.000. Then the drum will be operated at 100
F and at 12 psig.
Cut Point
A cut point is defined as that temperature on the whole crude TBP curve that
represents the limits (upper and lower) of a fraction to be produced. Consider the
curve shown in Fig. 1 of a typical crude oil TBP curve.
A fraction with an upper cut point of 100
F produces a yield of 20 % volume of
the whole crude as that fraction. The next adjacent fraction has a lower cut point of
100
F and an upper one of 200
F; this represents a yield of 30–20 % = 10 %
volume on crude.
14
D.S.J. Jones
such as Maxwell’s Data Book on Hydrocarbons or can be considered (rough and
not be used for definitive design) as
K ¼ Vapor Pressure at temperature
ð
Þ =Total Pressure
(3)
This relationship will be used for this calculation. The calculation is iterative (trial
and error) as follows (at 100
F):
1st Trial at 5 psig
2nd Trial at 12 psig
Mol fract. X
K
Y = KX
K
Y = KX
C 2
0.008
40.6
0.325
32.4
0.259
C 3
0.054
9.3
0.502
7.42
0.401
iC 4
0.021
3.55
0.075
2.38
0.05
nC 4
0.084
2.54
0.213
2.03
0.171
C 5
0.143
0.89
0.127
0.71
0.102
C 6
0.155
0.254
0.039
0.20
0.031
C 7
0.175
0.084
0.015
0.067
0.011
Comp 1
0.124
0.023
0.003
0.020
0.002
Comp 2
0.124
NEG
NEG
Comp 3
0.075
NEG
NEG
Comp 4
0.037
NEG
NEG
1.000
1.299
1.027
For second trial (estimate)
Take the K value of the highest fraction of y (in this case C3) where K = 9.3.
Take this K = 7.42 (new K ).
Make the second trial with K C3 at 7.42 which gives a systems pressure P as
follows: VP C 3 = 7.1 where VP C3 at 100
F is 190 psia.
Then P = 190/7.1 = 26.5 psia.
Second trial pressure = 26.5 psia = 11.8 psig. Let’s set it at 12 psig.
The second trial gives sum of Y’s = 1.027 and this is considered close enough to
1.000. Then the drum will be operated at 100
F and at 12 psig.
Cut Point
A cut point is defined as that temperature on the whole crude TBP curve that
represents the limits (upper and lower) of a fraction to be produced. Consider the
curve shown in Fig. 1 of a typical crude oil TBP curve.
A fraction with an upper cut point of 100
F produces a yield of 20 % volume of
the whole crude as that fraction. The next adjacent fraction has a lower cut point of
100
F and an upper one of 200
F; this represents a yield of 30–20 % = 10 %
volume on crude.
14
D.S.J. Jones