

Resid Catalytic Cracking
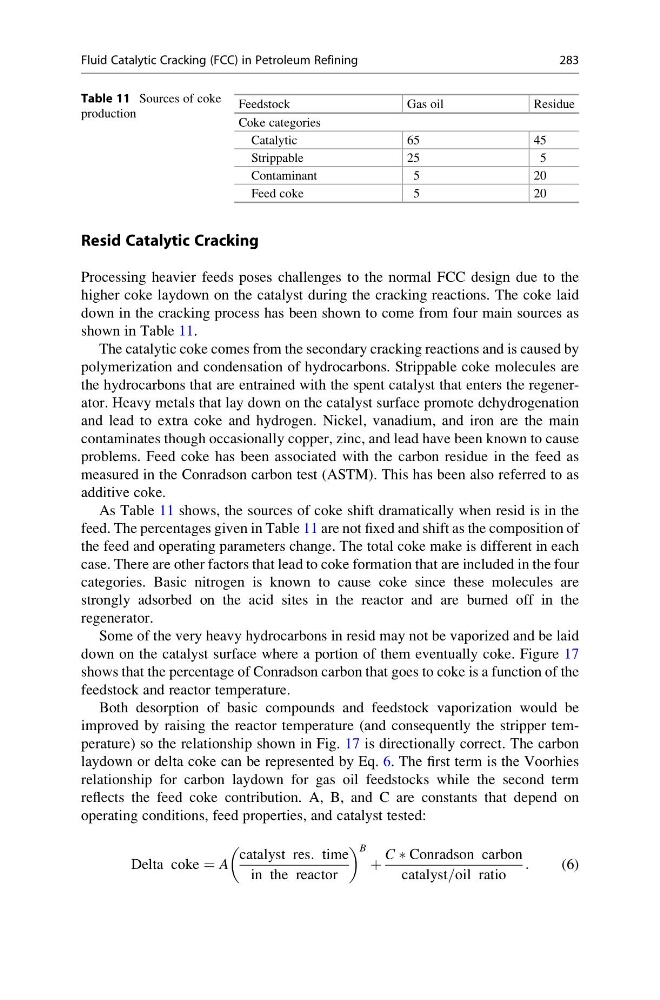
Processing heavier feeds poses challenges to the normal FCC design due to the
higher coke laydown on the catalyst during the cracking reactions. The coke laid
down in the cracking process has been shown to come from four main sources as
shown in Table 11.
The catalytic coke comes from the secondary cracking reactions and is caused by
polymerization and condensation of hydrocarbons. Strippable coke molecules are
the hydrocarbons that are entrained with the spent catalyst that enters the regenerator. Heavy metals that lay down on the catalyst surface promote dehydrogenation
and lead to extra coke and hydrogen. Nickel, vanadium, and iron are the main
contaminates though occasionally copper, zinc, and lead have been known to cause
problems. Feed coke has been associated with the carbon residue in the feed as
measured in the Conradson carbon test (ASTM). This has been also referred to as
additive coke.
As Table 11 shows, the sources of coke shift dramatically when resid is in the
feed. The percentages given in Table 11 are not fixed and shift as the composition of
the feed and operating parameters change. The total coke make is different in each
case. There are other factors that lead to coke formation that are included in the four
categories. Basic nitrogen is known to cause coke since these molecules are
strongly adsorbed on the acid sites in the reactor and are burned off in the
regenerator.
Some of the very heavy hydrocarbons in resid may not be vaporized and be laid
down on the catalyst surface where a portion of them eventually coke. Figure 17
shows that the percentage of Conradson carbon that goes to coke is a function of the
feedstock and reactor temperature.
Both desorption of basic compounds and feedstock vaporization would be
improved by raising the reactor temperature (and consequently the stripper temperature) so the relationship shown in Fig. 17 is directionally correct. The carbon
laydown or delta coke can be represented by Eq. 6. The first term is the Voorhies
relationship for carbon laydown for gas oil feedstocks while the second term
reflects the feed coke contribution. A, B, and C are constants that depend on
operating conditions, feed properties, and catalyst tested:
Delta coke ¼ A
catalyst res: time
in the reactor
B
þ
C Ã Conradson carbon
catalyst=oil ratio
:
(6)
Table 11 Sources of coke
production
Feedstock
Gas oil
Residue
Coke categories
Catalytic
65
45
Strippable
25
5
Contaminant
5
20
Feed coke
5
20
Fluid Catalytic Cracking (FCC) in Petroleum Refining
283
Processing heavier feeds poses challenges to the normal FCC design due to the
higher coke laydown on the catalyst during the cracking reactions. The coke laid
down in the cracking process has been shown to come from four main sources as
shown in Table 11.
The catalytic coke comes from the secondary cracking reactions and is caused by
polymerization and condensation of hydrocarbons. Strippable coke molecules are
the hydrocarbons that are entrained with the spent catalyst that enters the regenerator. Heavy metals that lay down on the catalyst surface promote dehydrogenation
and lead to extra coke and hydrogen. Nickel, vanadium, and iron are the main
contaminates though occasionally copper, zinc, and lead have been known to cause
problems. Feed coke has been associated with the carbon residue in the feed as
measured in the Conradson carbon test (ASTM). This has been also referred to as
additive coke.
As Table 11 shows, the sources of coke shift dramatically when resid is in the
feed. The percentages given in Table 11 are not fixed and shift as the composition of
the feed and operating parameters change. The total coke make is different in each
case. There are other factors that lead to coke formation that are included in the four
categories. Basic nitrogen is known to cause coke since these molecules are
strongly adsorbed on the acid sites in the reactor and are burned off in the
regenerator.
Some of the very heavy hydrocarbons in resid may not be vaporized and be laid
down on the catalyst surface where a portion of them eventually coke. Figure 17
shows that the percentage of Conradson carbon that goes to coke is a function of the
feedstock and reactor temperature.
Both desorption of basic compounds and feedstock vaporization would be
improved by raising the reactor temperature (and consequently the stripper temperature) so the relationship shown in Fig. 17 is directionally correct. The carbon
laydown or delta coke can be represented by Eq. 6. The first term is the Voorhies
relationship for carbon laydown for gas oil feedstocks while the second term
reflects the feed coke contribution. A, B, and C are constants that depend on
operating conditions, feed properties, and catalyst tested:
Delta coke ¼ A
catalyst res: time
in the reactor
B
þ
C Ã Conradson carbon
catalyst=oil ratio
:
(6)
Table 11 Sources of coke
production
Feedstock
Gas oil
Residue
Coke categories
Catalytic
65
45
Strippable
25
5
Contaminant
5
20
Feed coke
5
20
Fluid Catalytic Cracking (FCC) in Petroleum Refining
283