

be taken to aid in the optimization of the system. It is critical that the catalyst be
properly fluidized entering the standpipe since refluidizing catalyst is very difficult.
Over-aeration is a more common problem than under-aeration in commercial
operations.
Process Control
While there are many ways to configure the controls of the cat cracker, Fig. 6 shows
the typical scheme used in the industry for a slide valve-controlled unit.
The reactor pressure is controlled by the inlet pressure to the wet gas compressor, but the actual pressure at the top of the reactor in the dilute phase is this
pressure plus the pressure drop taken through the main fractionator overhead
system, the main fractionator, and the reactor overhead system (cyclones, plenum,
and overhead vapor line). At steady state, this pressure should be constant. The
regenerator pressure is controlled by the flue gas slide valve and is maintained to
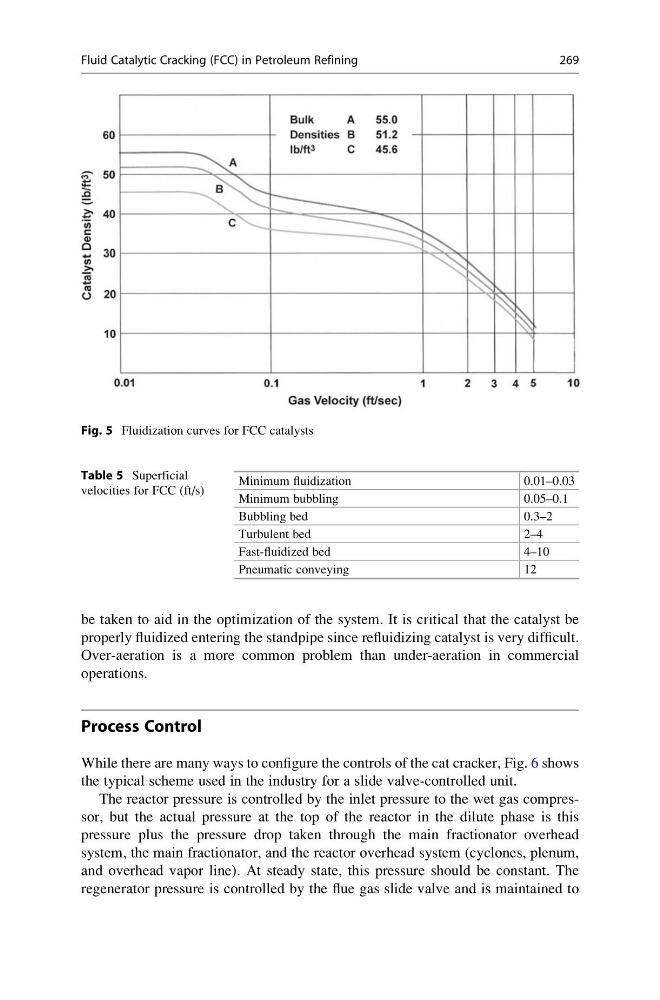
Fig. 5 Fluidization curves for FCC catalysts
Table 5 Superficial
velocities for FCC (ft/s)
Minimum fluidization
0.01–0.03
Minimum bubbling
0.05–0.1
Bubbling bed
0.3–2
Turbulent bed
2–4
Fast-fluidized bed
4–10
Pneumatic conveying
12
Fluid Catalytic Cracking (FCC) in Petroleum Refining
269
properly fluidized entering the standpipe since refluidizing catalyst is very difficult.
Over-aeration is a more common problem than under-aeration in commercial
operations.
Process Control
While there are many ways to configure the controls of the cat cracker, Fig. 6 shows
the typical scheme used in the industry for a slide valve-controlled unit.
The reactor pressure is controlled by the inlet pressure to the wet gas compressor, but the actual pressure at the top of the reactor in the dilute phase is this
pressure plus the pressure drop taken through the main fractionator overhead
system, the main fractionator, and the reactor overhead system (cyclones, plenum,
and overhead vapor line). At steady state, this pressure should be constant. The
regenerator pressure is controlled by the flue gas slide valve and is maintained to
Fig. 5 Fluidization curves for FCC catalysts
Table 5 Superficial
velocities for FCC (ft/s)
Minimum fluidization
0.01–0.03
Minimum bubbling
0.05–0.1
Bubbling bed
0.3–2
Turbulent bed
2–4
Fast-fluidized bed
4–10
Pneumatic conveying
12
Fluid Catalytic Cracking (FCC) in Petroleum Refining
269